 3
3peptides
spectra
0.000 | 0.000
0.000 | 0.000
0.000 | 0.021
0.000 | 0.000
0.015 | 0.217
0.351 | 0.544
0.373 | 0.443
0.000 | 0.014
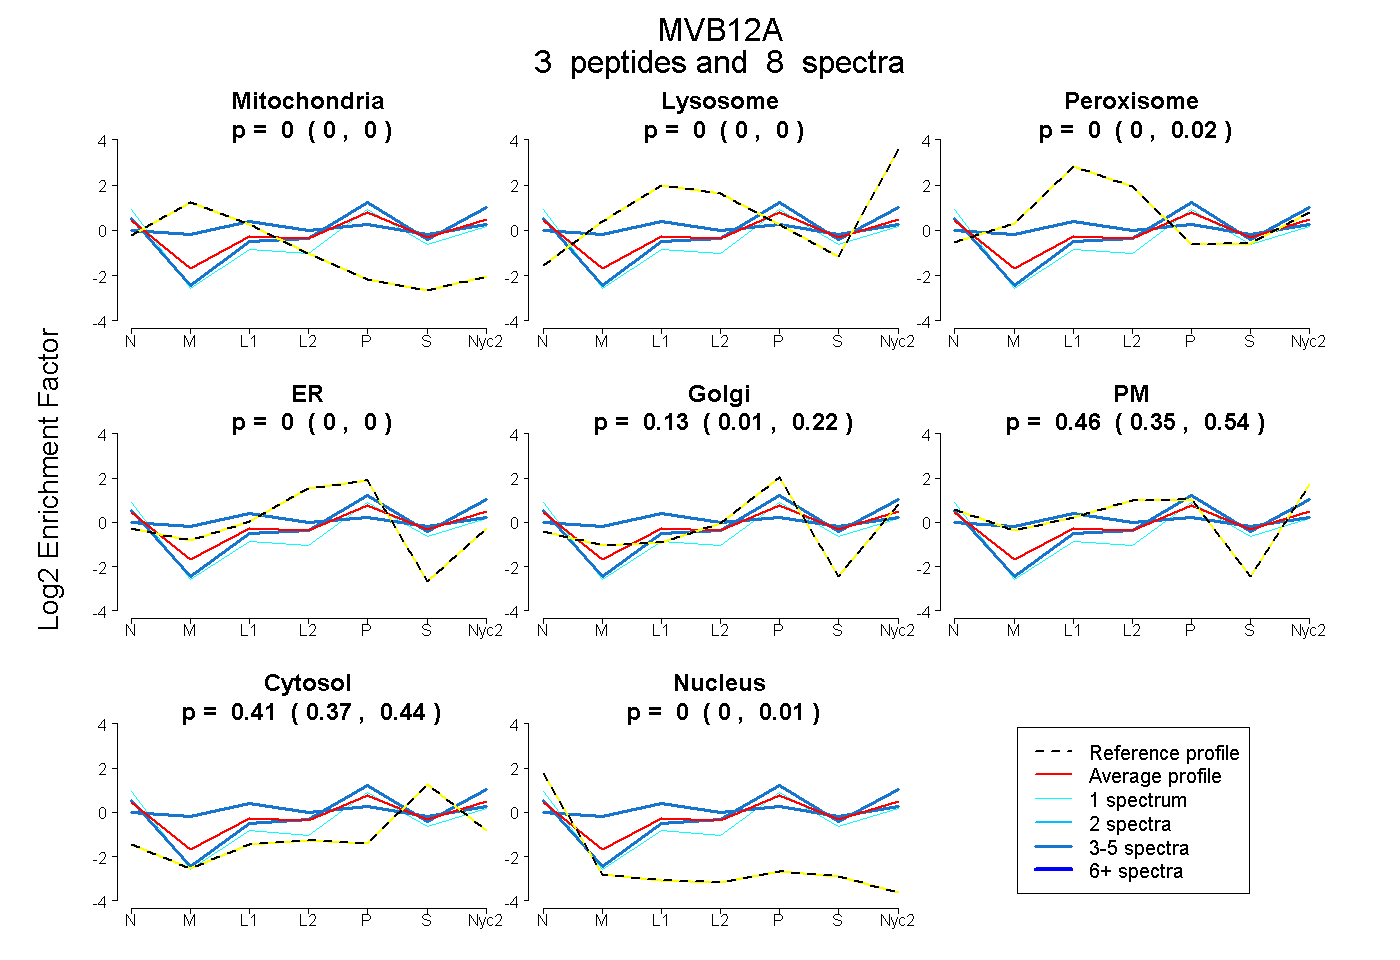
| Plot | Mito | Lyso | Perox | ER | Golgi | PM | Cytosol | Nucleus | |||||
| Expt A |
3 peptides |
8 spectra |
|
0.000 0.000 | 0.000 |
0.000 0.000 | 0.000 |
0.000 0.000 | 0.021 |
0.000 0.000 | 0.000 |
0.126 0.015 | 0.217 |
0.460 0.351 | 0.544 |
0.415 0.373 | 0.443 |
0.000 0.000 | 0.014 |
| 1 spectrum, GLSLDQPK | 0.000 | 0.000 | 0.000 | 0.000 | 0.373 | 0.181 | 0.328 | 0.118 | ||
| 3 spectra, LVPKPGTLSQDMR | 0.000 | 0.000 | 0.000 | 0.000 | 0.311 | 0.332 | 0.357 | 0.000 | ||
| 4 spectra, LMPLGTADVVVSDVK | 0.060 | 0.000 | 0.315 | 0.000 | 0.144 | 0.197 | 0.284 | 0.000 |
| Plot | Lyso | Other | |||||||||||
| Expt C |
1 peptide |
2 spectra |
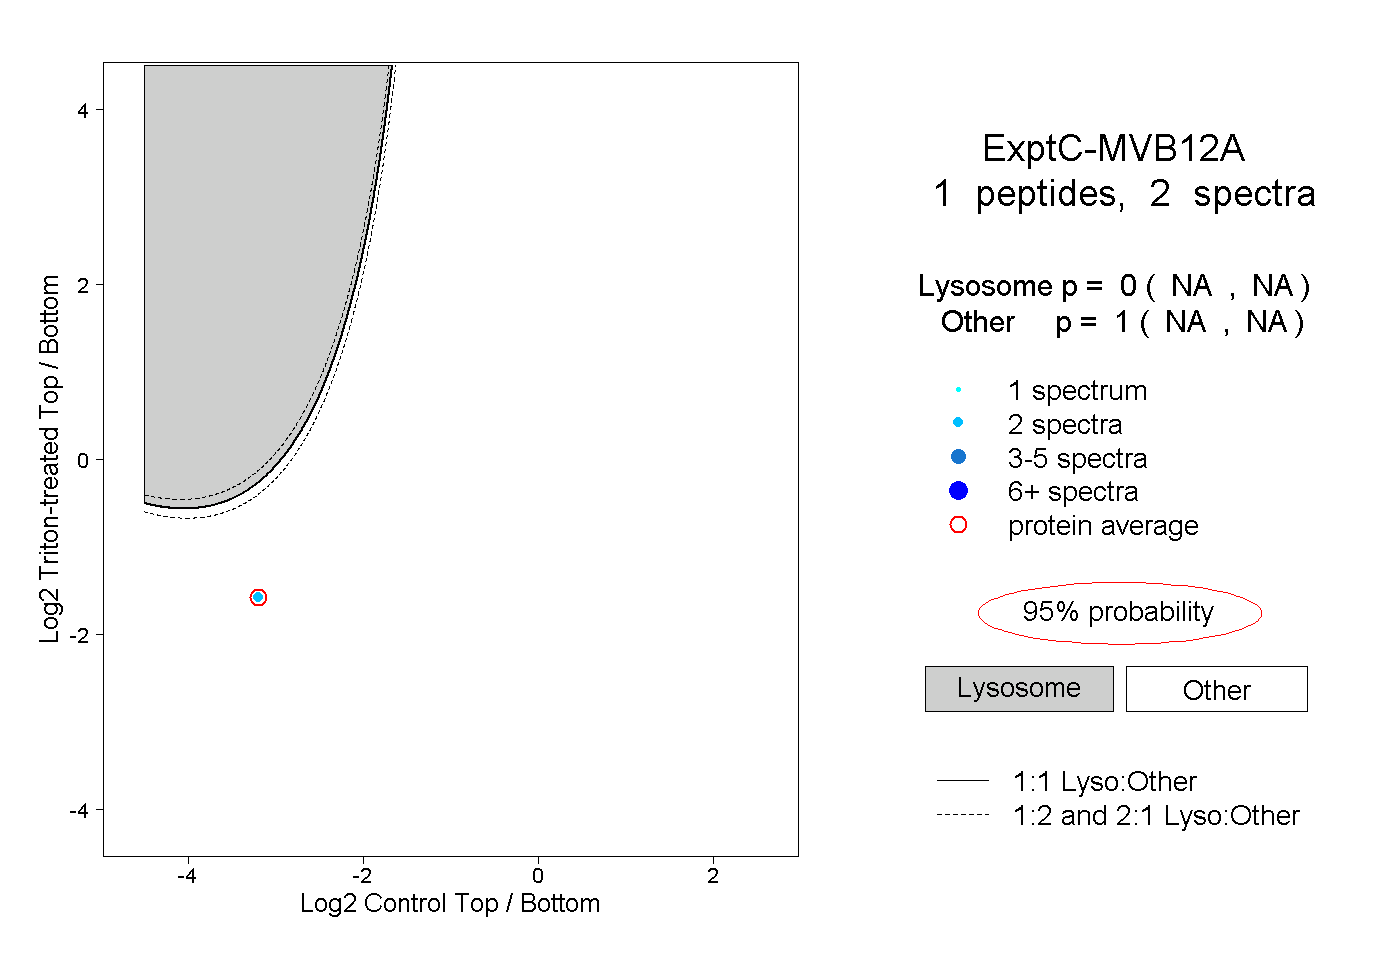 |
0.000 NA | NA |
1.000 NA | NA |