13
13peptides
spectra
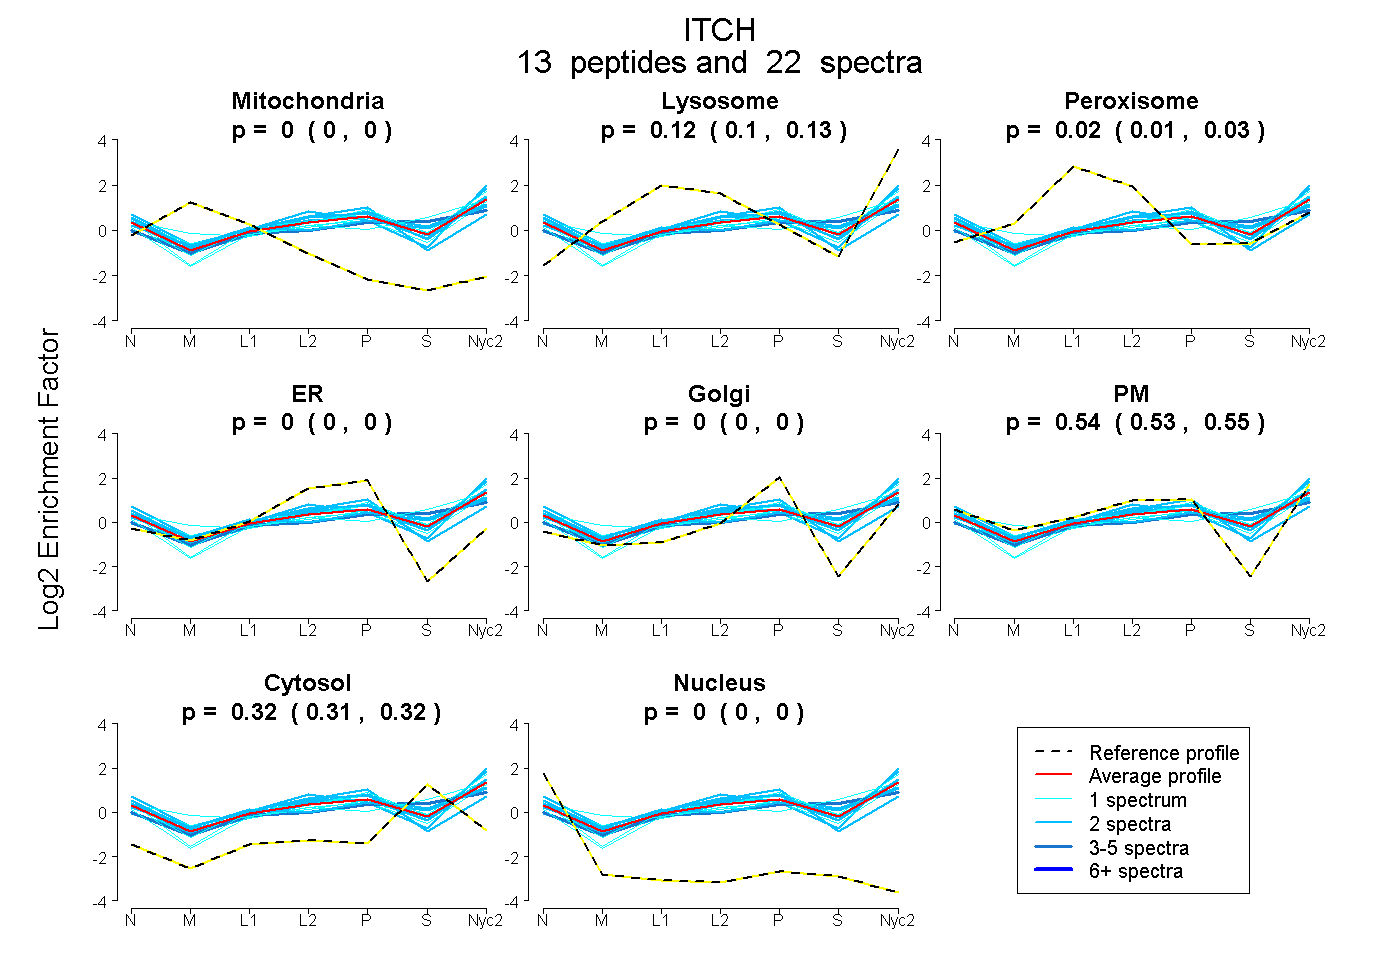
0.000 | 0.000
0.102 | 0.129
0.007 | 0.029
0.000 | 0.000
0.000 | 0.000
0.533 | 0.552
0.314 | 0.324
0.000 | 0.000
4peptides
spectra
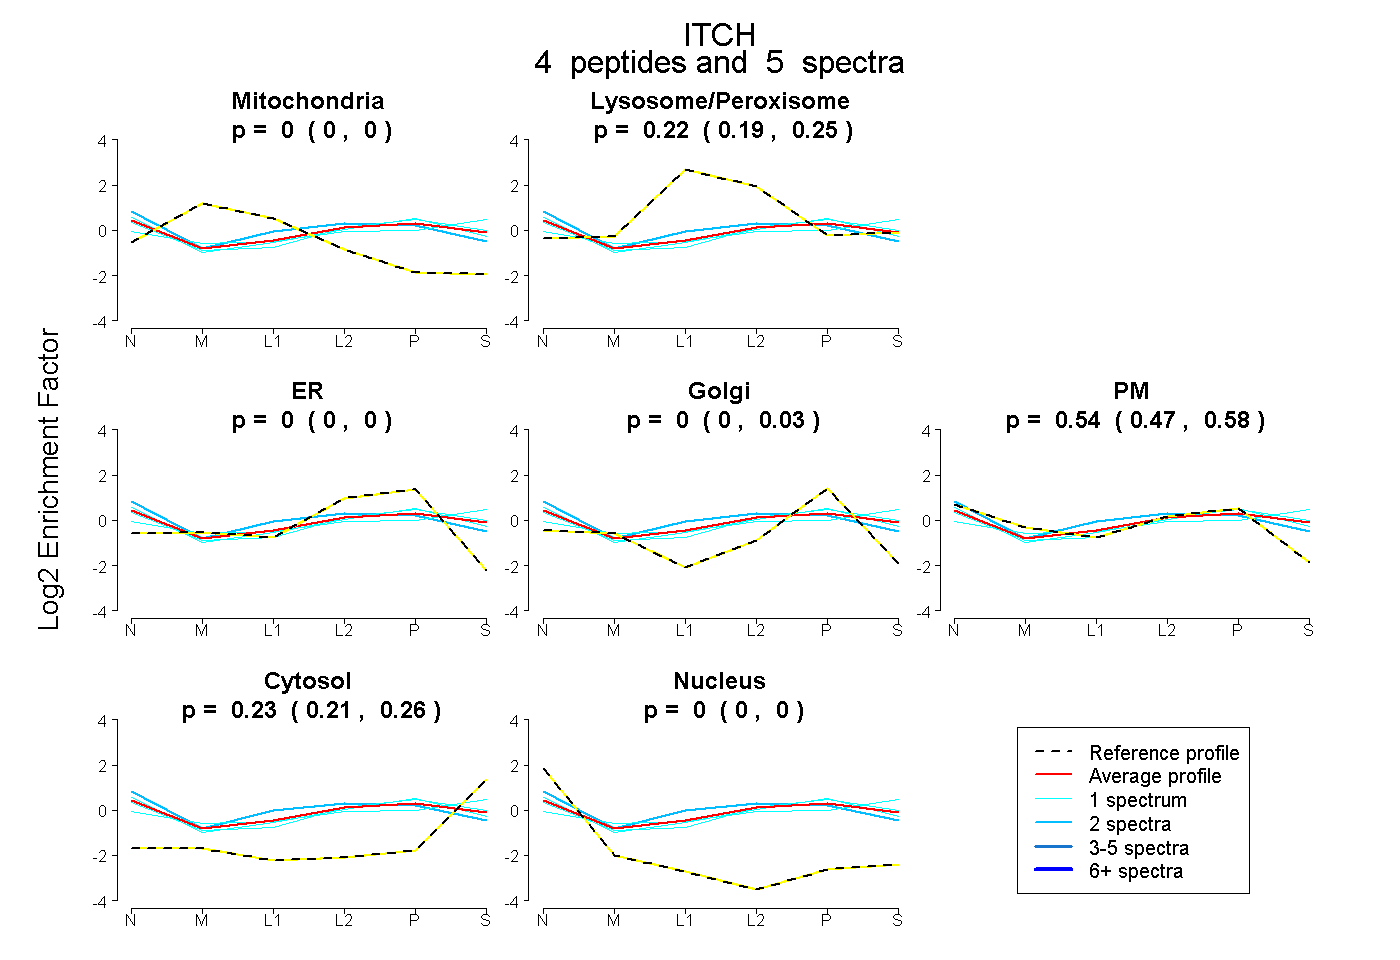
0.000 | 0.000
0.191 | 0.249
0.000 | 0.000
0.000 | 0.034
0.474 | 0.580
0.207 | 0.256
0.000 | 0.000
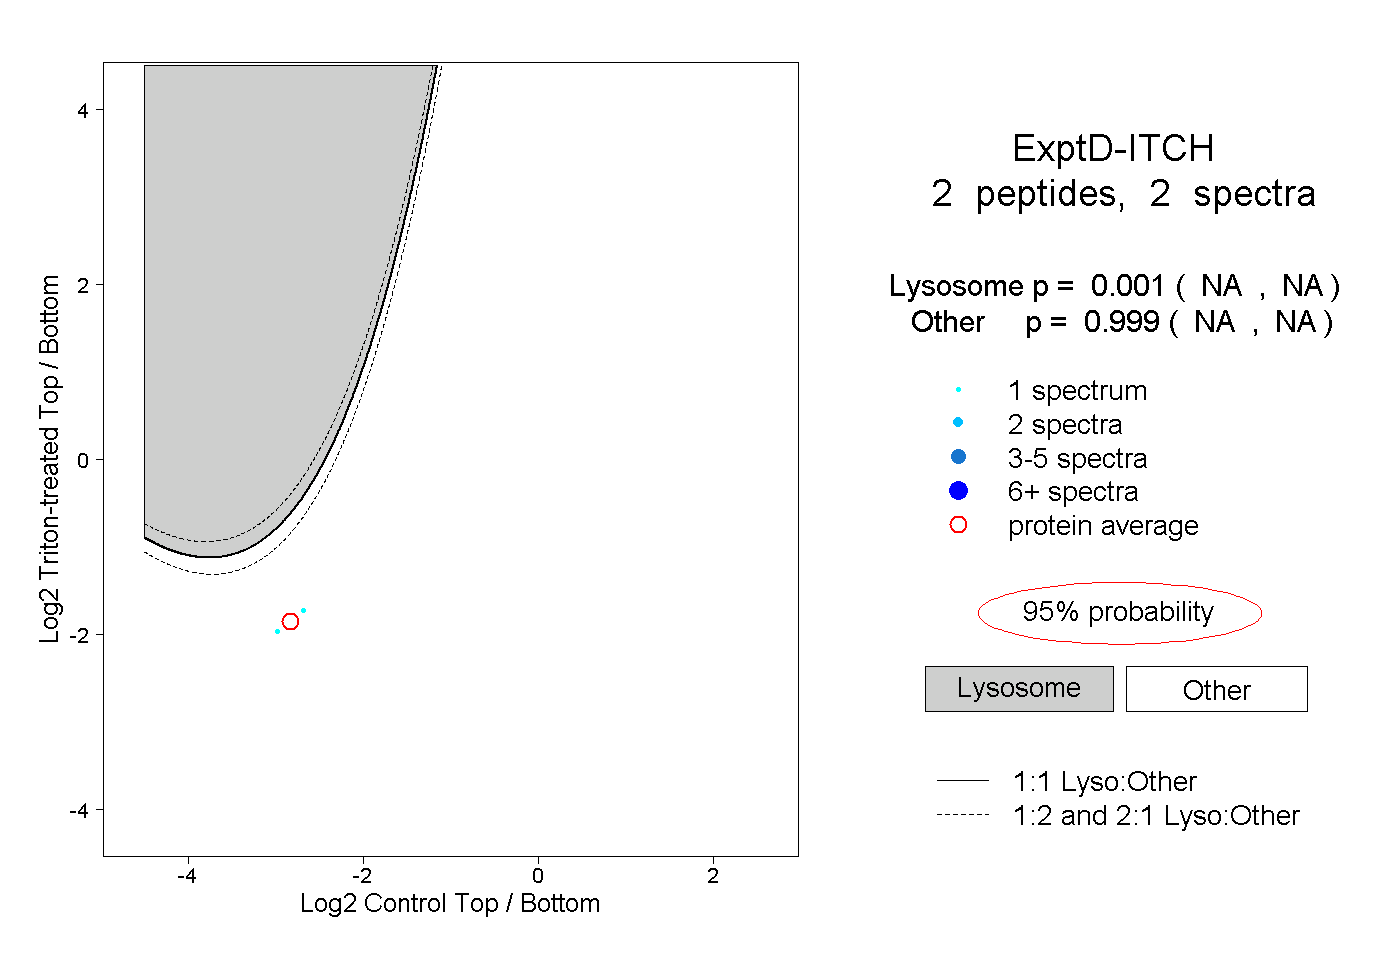
9peptides
spectra
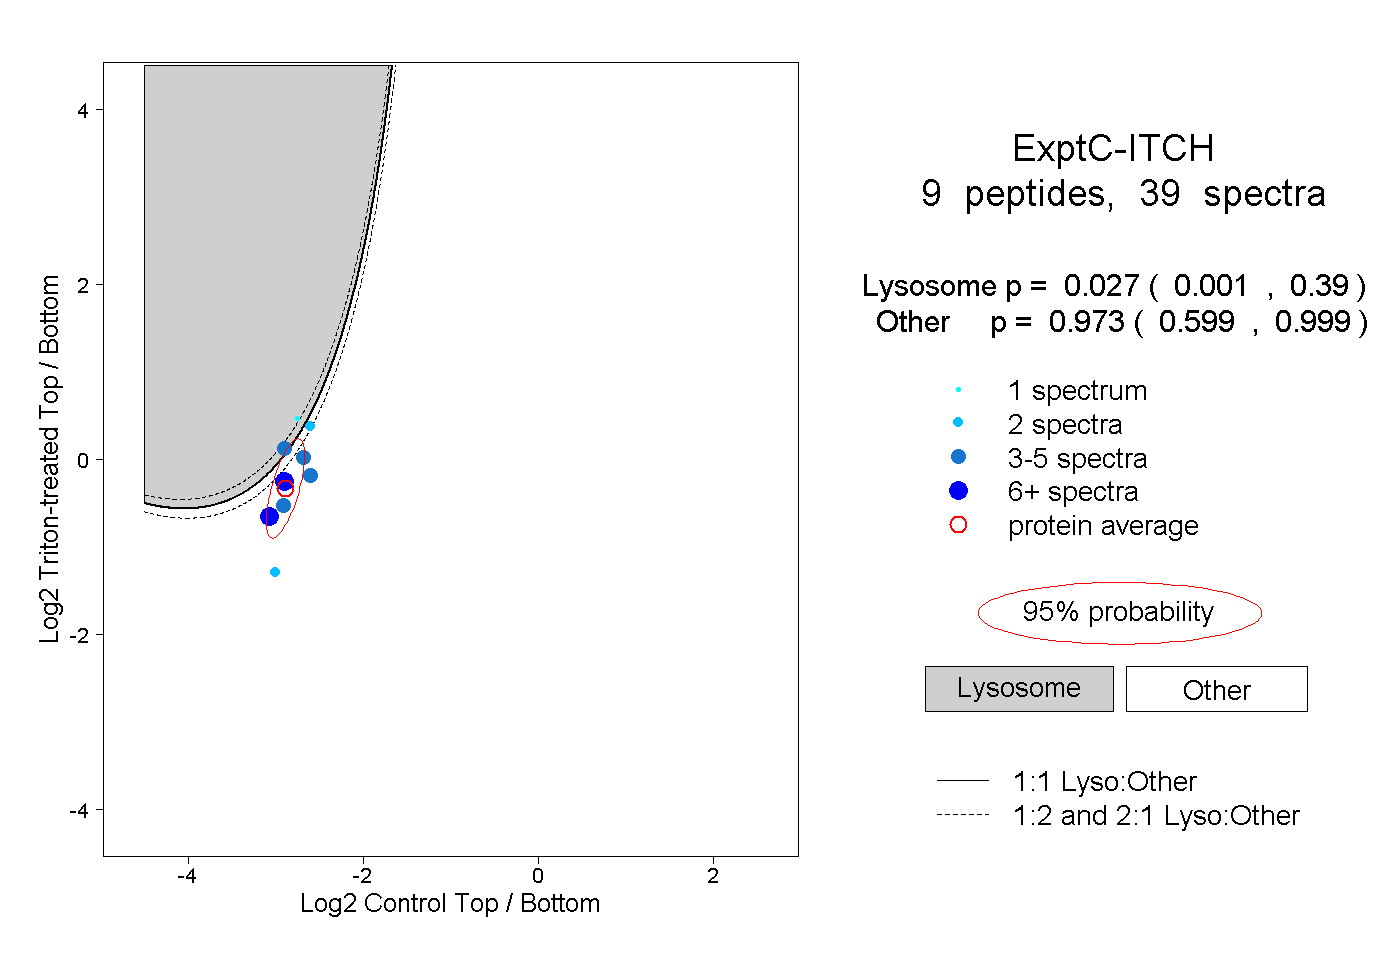
0.001 | 0.390
0.599 | 0.999