 13
13peptides
spectra
0.000 | 0.000
0.102 | 0.129
0.007 | 0.029
0.000 | 0.000
0.000 | 0.000
0.533 | 0.552
0.314 | 0.324
0.000 | 0.000
| Plot | Mito | Lyso | Perox | ER | Golgi | PM | Cytosol | Nucleus | |||||
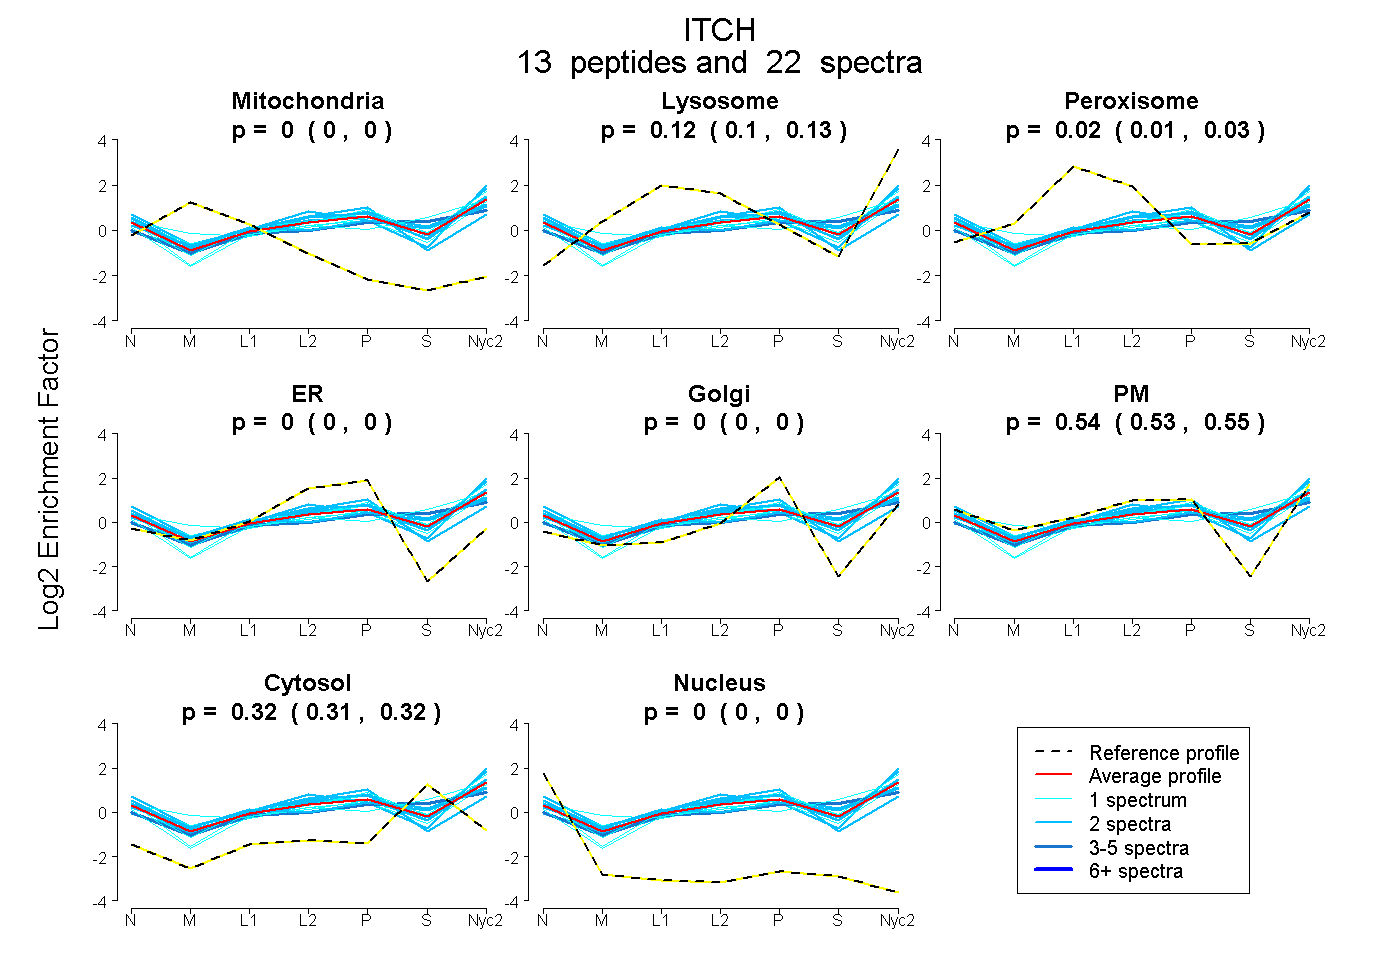
| Expt A |
13 peptides |
22 spectra |
|
0.000 0.000 | 0.000 |
0.117 0.102 | 0.129 |
0.019 0.007 | 0.029 |
0.000 0.000 | 0.000 |
0.000 0.000 | 0.000 |
0.543 0.533 | 0.552 |
0.320 0.314 | 0.324 |
0.000 0.000 | 0.000 |
| 3 spectra, NYEQWQLQR | 0.000 | 0.098 | 0.072 | 0.000 | 0.000 | 0.379 | 0.451 | 0.000 | ||
| 1 spectrum, ILNKPVGLK | 0.000 | 0.078 | 0.029 | 0.000 | 0.000 | 0.613 | 0.280 | 0.000 | ||
| 2 spectra, TTTWQRPTLESVR | 0.000 | 0.113 | 0.040 | 0.000 | 0.000 | 0.593 | 0.254 | 0.000 | ||
| 1 spectrum, SQLQGAMQQFNQR | 0.000 | 0.086 | 0.000 | 0.000 | 0.000 | 0.582 | 0.332 | 0.000 | ||
| 2 spectra, IYYVDHFTR | 0.000 | 0.154 | 0.068 | 0.000 | 0.000 | 0.414 | 0.364 | 0.000 | ||
| 2 spectra, VYYVDHVEK | 0.000 | 0.079 | 0.113 | 0.000 | 0.000 | 0.449 | 0.360 | 0.000 | ||
| 1 spectrum, SQGQLNEKPLPEGWEMR | 0.000 | 0.182 | 0.000 | 0.000 | 0.000 | 0.513 | 0.306 | 0.000 | ||
| 1 spectrum, SYEQLK | 0.000 | 0.137 | 0.000 | 0.000 | 0.000 | 0.543 | 0.320 | 0.000 | ||
| 1 spectrum, SQLQITVISAK | 0.000 | 0.194 | 0.000 | 0.000 | 0.000 | 0.327 | 0.480 | 0.000 | ||
| 2 spectra, FIAMALFHGK | 0.000 | 0.160 | 0.000 | 0.000 | 0.000 | 0.652 | 0.188 | 0.000 | ||
| 2 spectra, LLQFVTGTCR | 0.000 | 0.000 | 0.034 | 0.119 | 0.000 | 0.611 | 0.235 | 0.000 | ||
| 2 spectra, FIDTGFSLPFYK | 0.000 | 0.145 | 0.000 | 0.000 | 0.000 | 0.584 | 0.271 | 0.000 | ||
| 2 spectra, ENWLPR | 0.000 | 0.100 | 0.000 | 0.000 | 0.000 | 0.590 | 0.310 | 0.000 |
| Plot | Mito | Lyso or Perox | ER | Golgi | PM | Cytosol | Nucleus | ||||||
| Expt B |
4 peptides |
5 spectra |
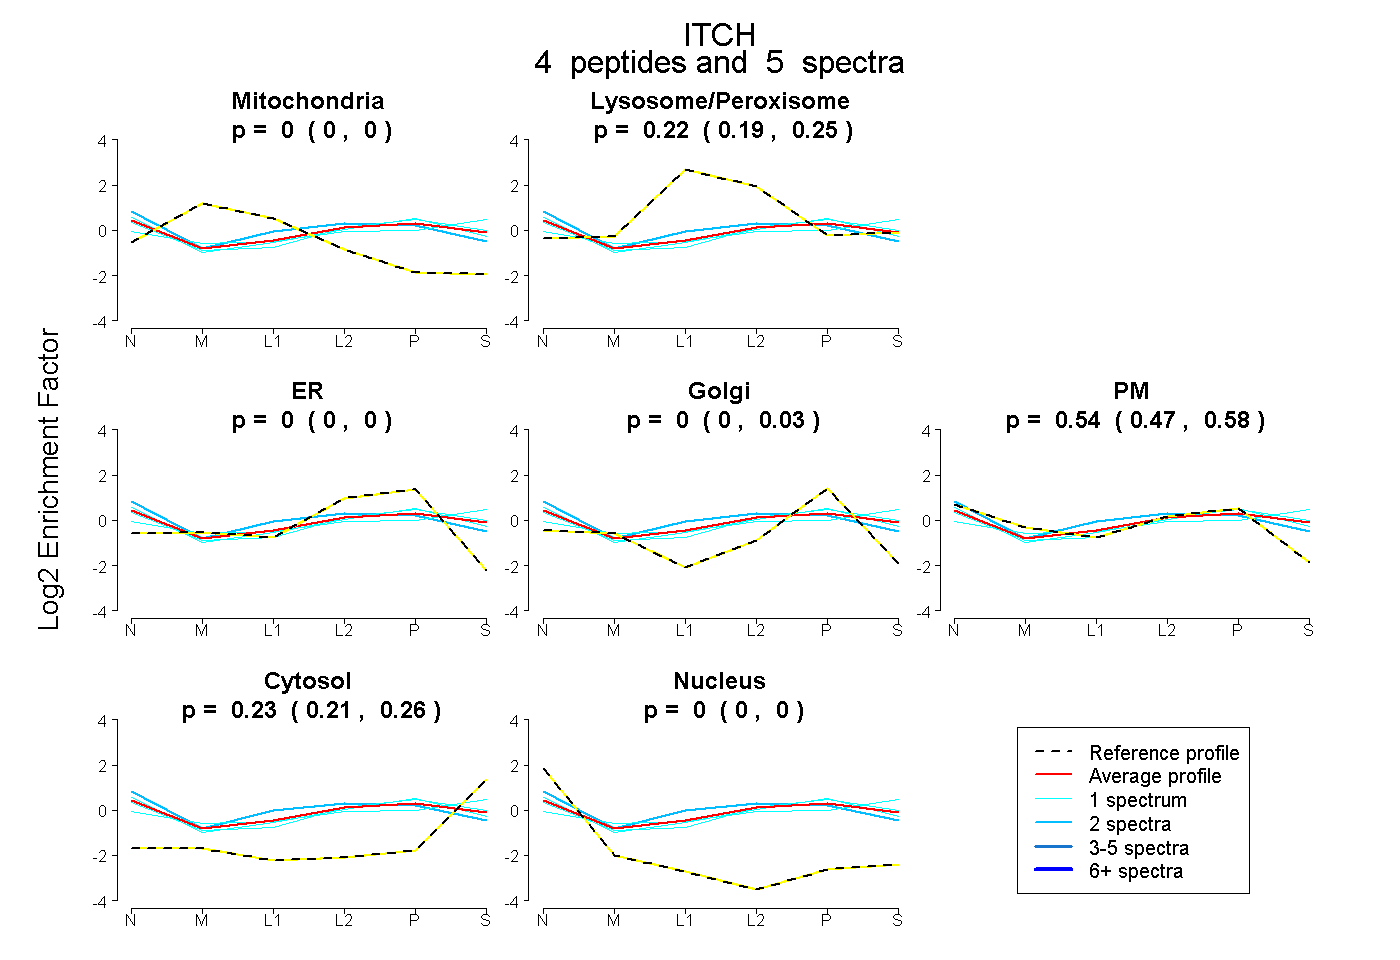 |
0.000 0.000 | 0.000 |
0.221 0.191 | 0.249 |
0.000 0.000 | 0.000 |
0.000 0.000 | 0.034 |
0.544 0.474 | 0.580 |
0.235 0.207 | 0.256 |
0.000 0.000 | 0.000 |
|||
| Plot | Lyso | Other | |||||||||||
| Expt C |
9 peptides |
39 spectra |
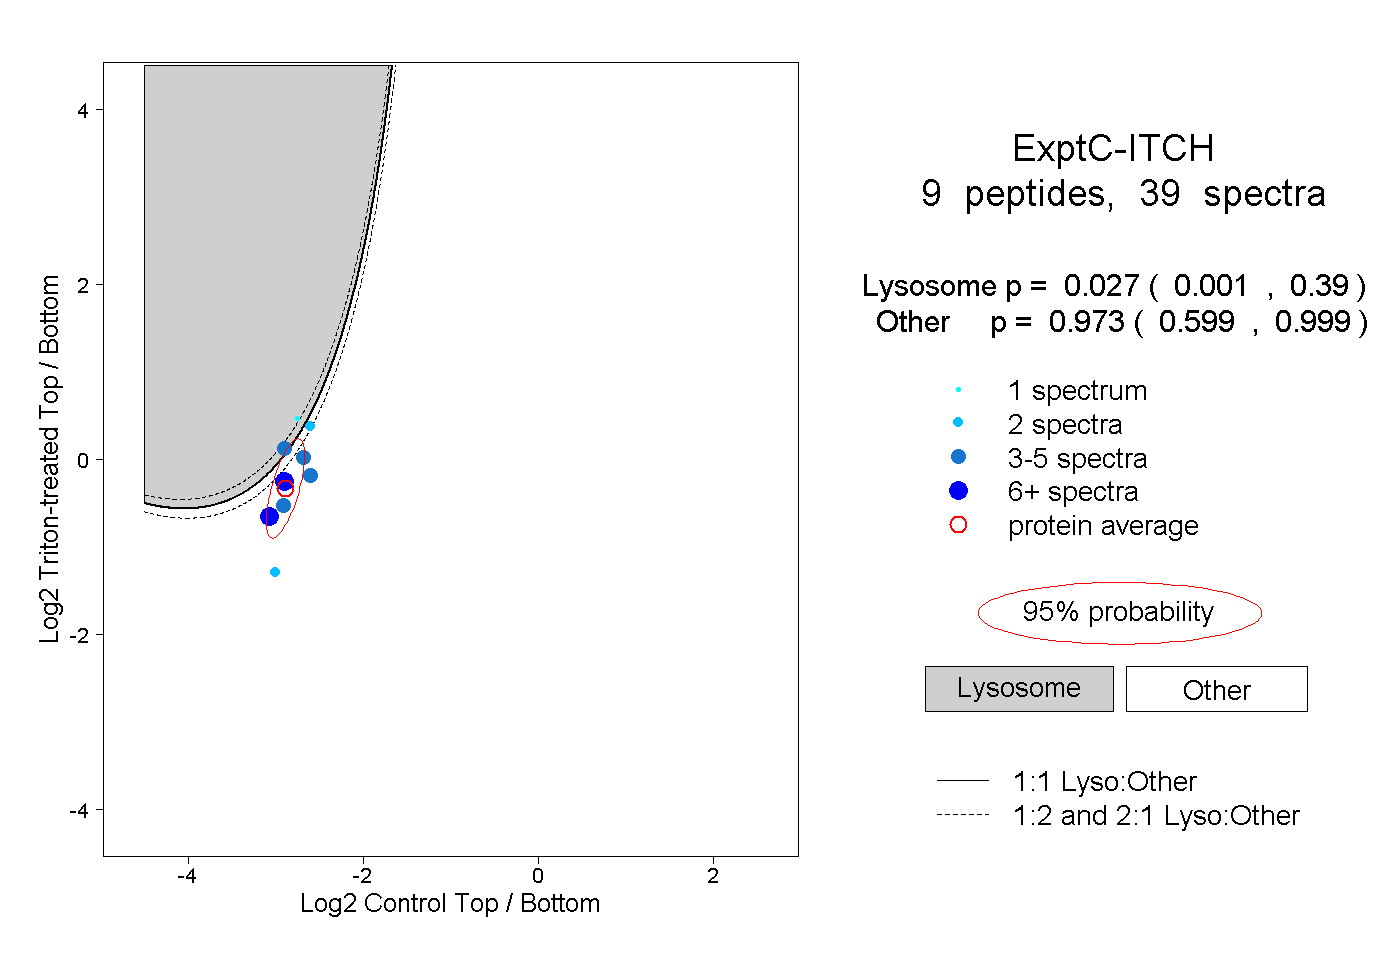 |
0.027 0.001 | 0.390 |
0.973 0.599 | 0.999 |
||||||||
| Plot | Lyso | Other | |||||||||||
| Expt D |
2 peptides |
2 spectra |
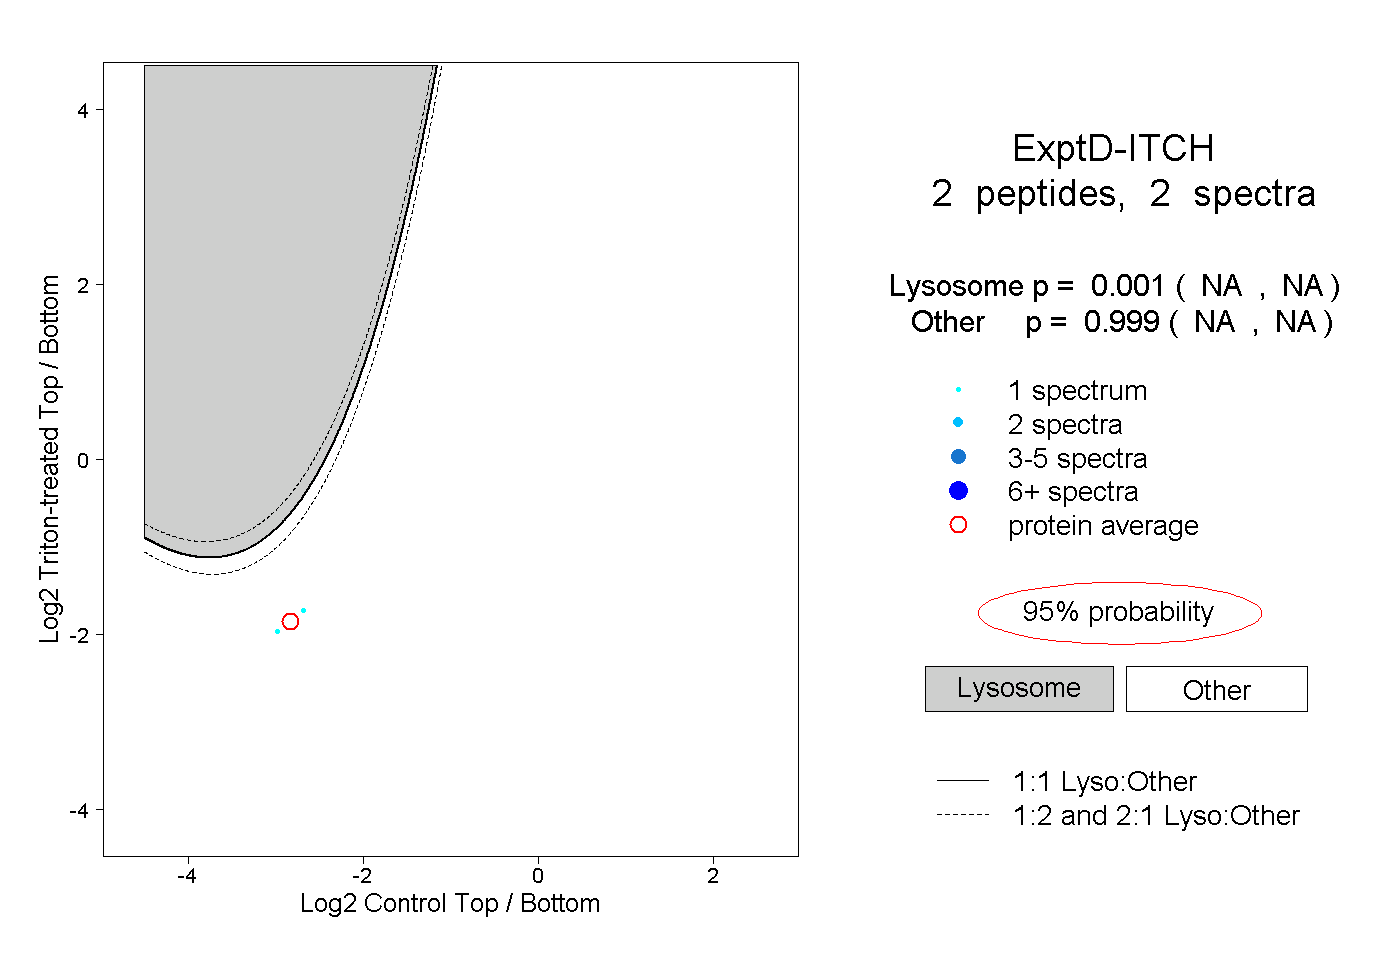 |
0.001 NA | NA |
0.999 NA | NA |