 5
5peptides
spectra
0.076 | 0.160
0.000 | 0.000
0.000 | 0.000
0.366 | 0.681
0.077 | 0.454
0.000 | 0.000
0.000 | 0.000
0.001 | 0.104
| Plot | Mito | Lyso | Perox | ER | Golgi | PM | Cytosol | Nucleus | |||||
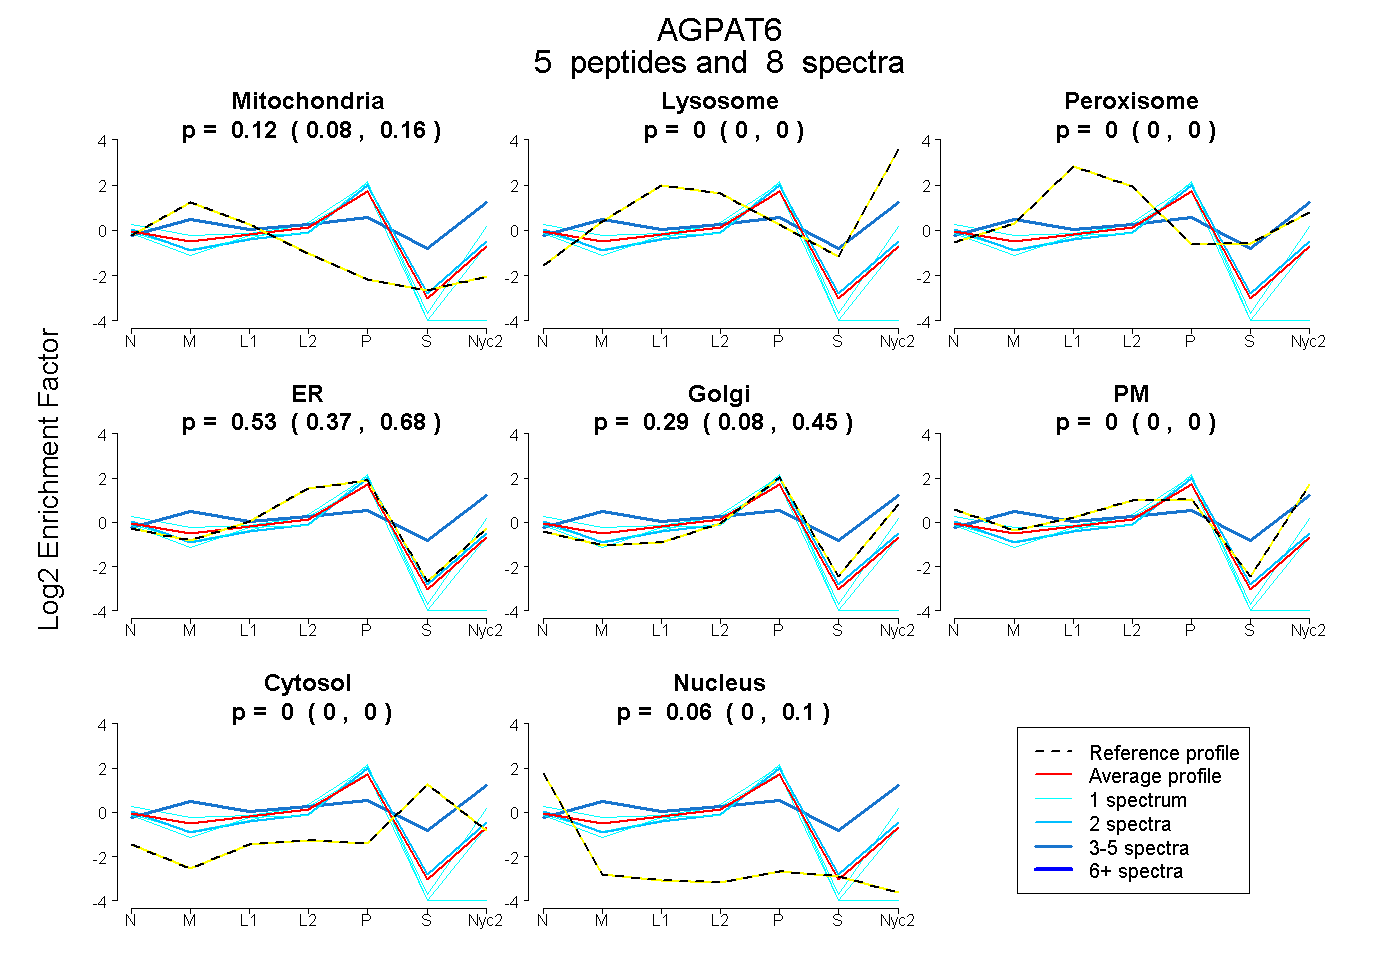
| Expt A |
5 peptides |
8 spectra |
|
0.122 0.076 | 0.160 |
0.000 0.000 | 0.000 |
0.000 0.000 | 0.000 |
0.535 0.366 | 0.681 |
0.287 0.077 | 0.454 |
0.000 0.000 | 0.000 |
0.000 0.000 | 0.000 |
0.056 0.001 | 0.104 |
| 1 spectrum, ALTAIITYHNR | 0.000 | 0.000 | 0.000 | 0.473 | 0.495 | 0.002 | 0.000 | 0.030 | ||
| 1 spectrum, YGMVTYLLR | 0.000 | 0.000 | 0.000 | 0.559 | 0.329 | 0.000 | 0.000 | 0.112 | ||
| 2 spectra, LTEHVQDK | 0.016 | 0.000 | 0.000 | 0.427 | 0.460 | 0.000 | 0.000 | 0.096 | ||
| 3 spectra, FSAEELESWNLLSR | 0.129 | 0.277 | 0.000 | 0.000 | 0.119 | 0.317 | 0.158 | 0.000 | ||
| 1 spectrum, ACPHVWFER | 0.172 | 0.000 | 0.000 | 0.623 | 0.000 | 0.000 | 0.000 | 0.205 |
| Plot | Mito | Lyso or Perox | ER | Golgi | PM | Cytosol | Nucleus | ||||||
| Expt B |
1 peptide |
2 spectra |
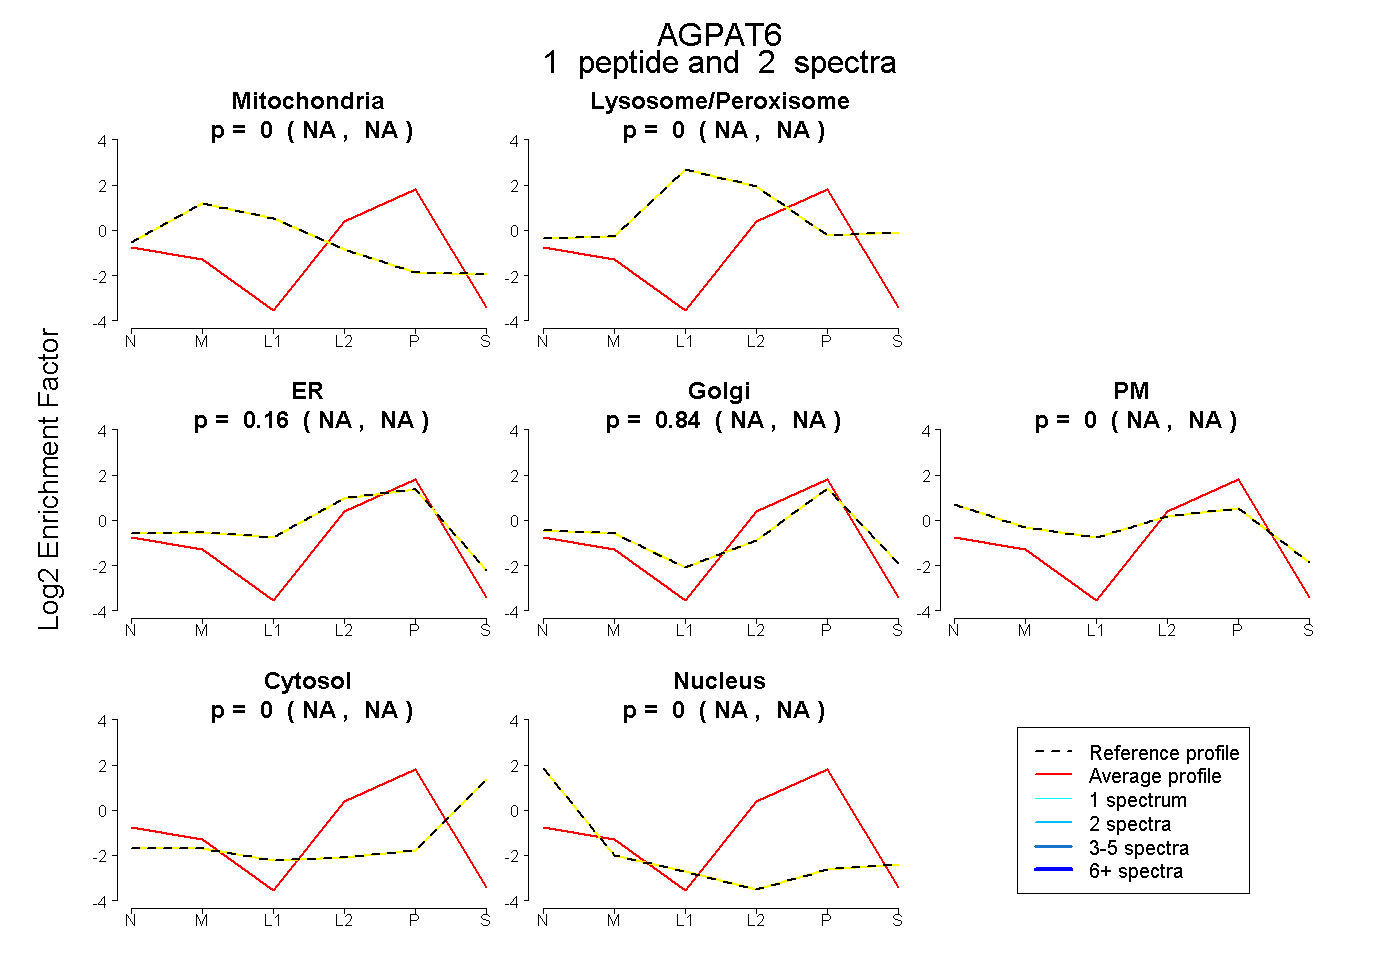 |
0.000 NA | NA |
0.000 NA | NA |
0.164 NA | NA |
0.836 NA | NA |
0.000 NA | NA |
0.000 NA | NA |
0.000 NA | NA |
|||
| Plot | Lyso | Other | |||||||||||
| Expt C |
1 peptide |
2 spectra |
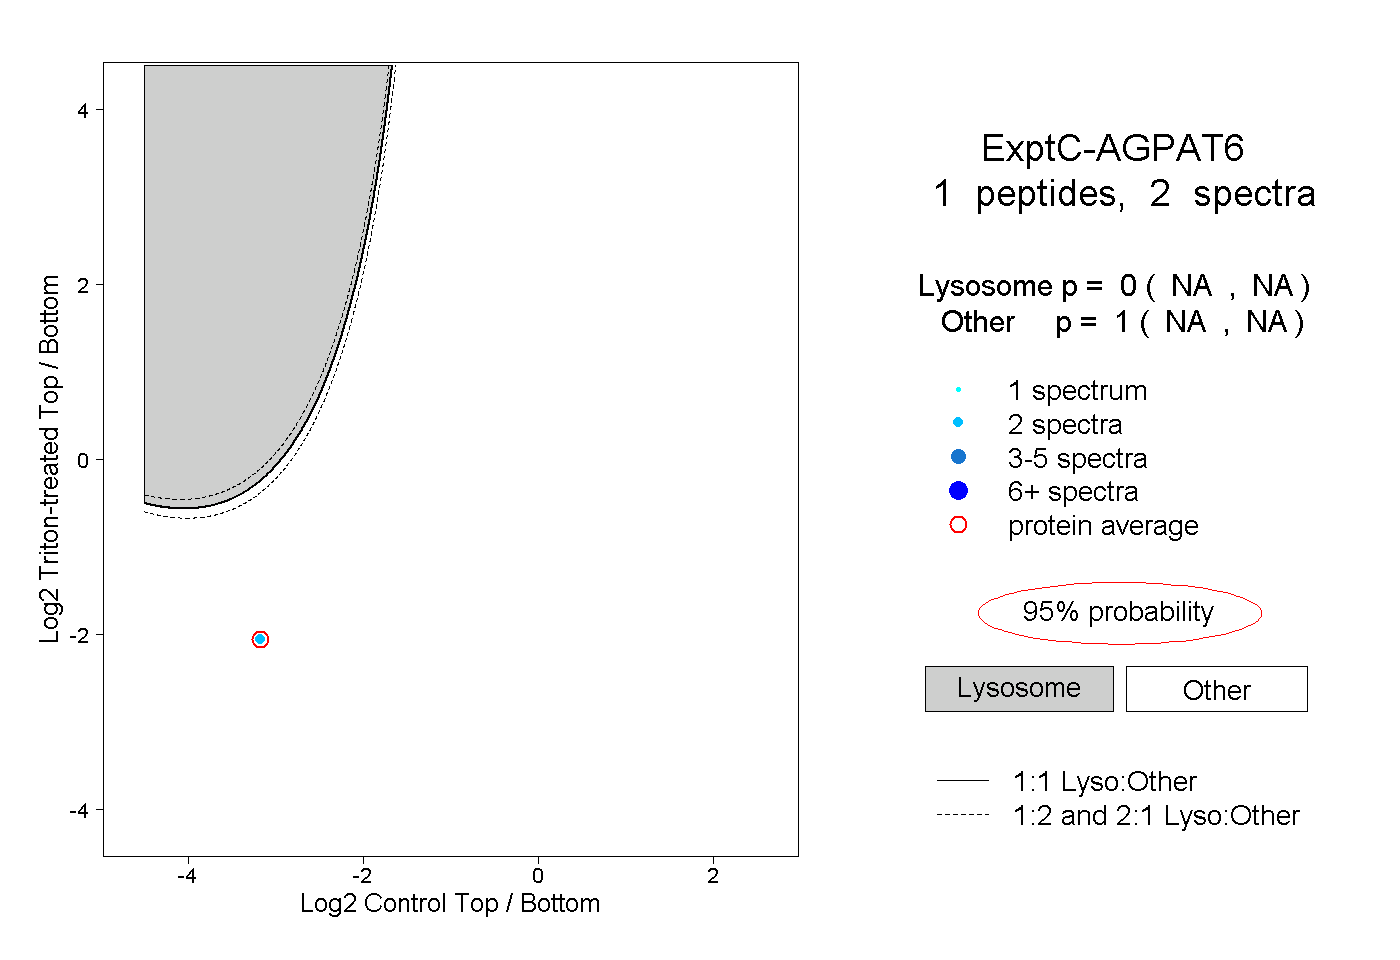 |
0.000 NA | NA |
1.000 NA | NA |