 3
3peptides
spectra
0.000 | 0.000
0.000 | 0.000
0.000 | 0.011
0.000 | 0.030
0.000 | 0.068
0.000 | 0.094
0.855 | 0.919
0.003 | 0.095
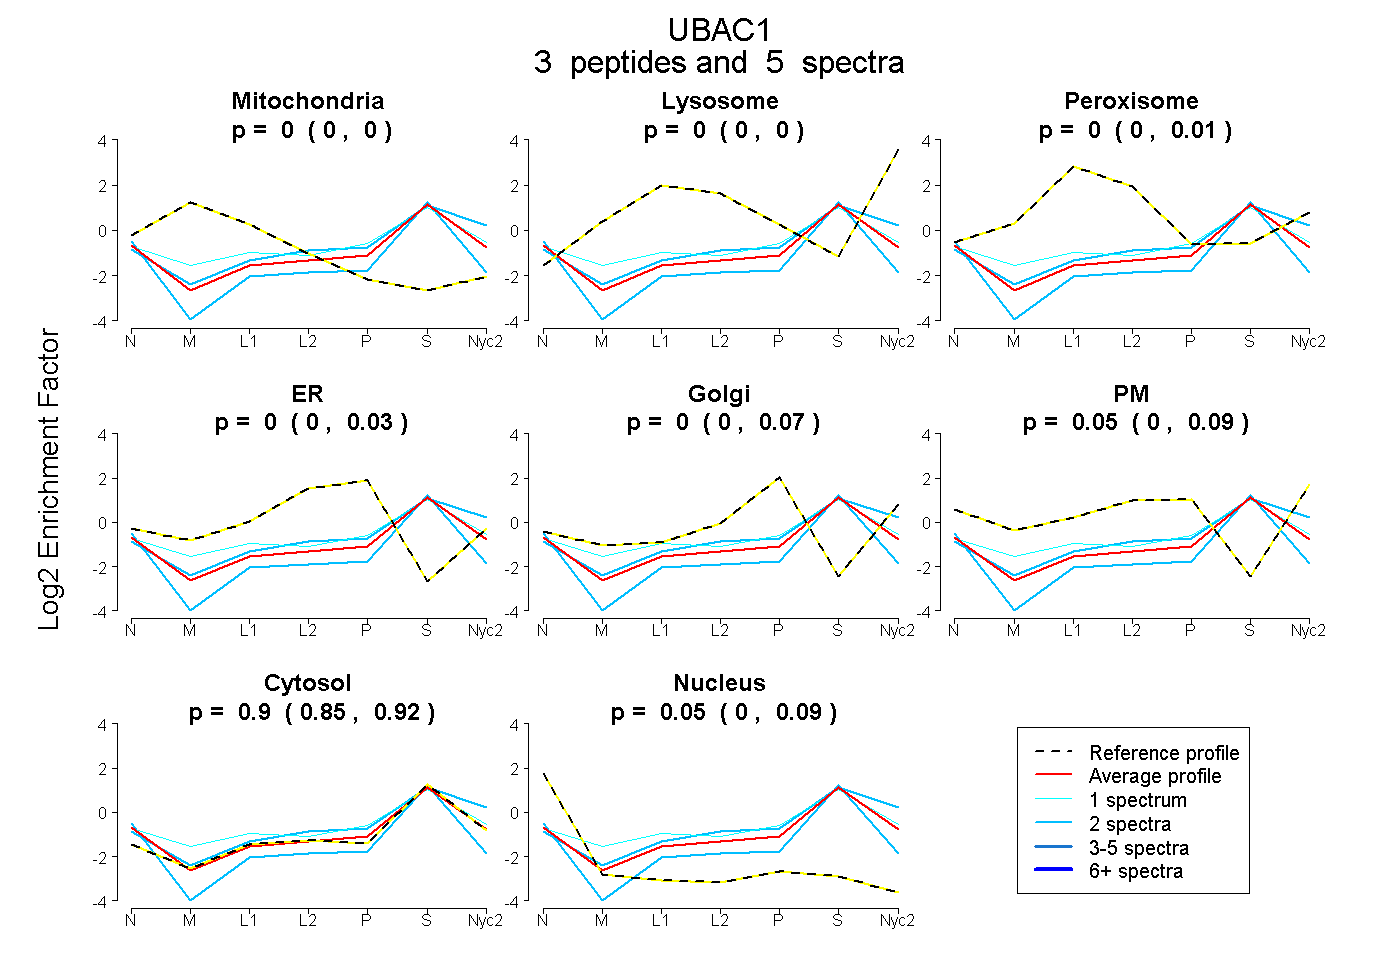
| Plot | Mito | Lyso | Perox | ER | Golgi | PM | Cytosol | Nucleus | |||||
| Expt A |
3 peptides |
5 spectra |
|
0.000 0.000 | 0.000 |
0.000 0.000 | 0.000 |
0.000 0.000 | 0.011 |
0.000 0.000 | 0.030 |
0.000 0.000 | 0.068 |
0.049 0.000 | 0.094 |
0.897 0.855 | 0.919 |
0.054 0.003 | 0.095 |
| 1 spectrum, EVIDALR | 0.023 | 0.000 | 0.071 | 0.000 | 0.089 | 0.049 | 0.767 | 0.000 | ||
| 2 spectra, ATANLPACSTDR | 0.000 | 0.000 | 0.000 | 0.000 | 0.000 | 0.000 | 0.795 | 0.205 | ||
| 2 spectra, AVISLMEMGFDEK | 0.000 | 0.043 | 0.000 | 0.000 | 0.000 | 0.129 | 0.828 | 0.000 |