 3
3peptides
spectra
0.000 | 0.000
0.000 | 0.000
0.000 | 0.000
0.000 | 0.019
0.000 | 0.003
0.000 | 0.000
0.569 | 0.686
0.293 | 0.414
1peptide
spectrum

NA | NA
NA | NA
NA | NA
NA | NA
NA | NA
NA | NA
NA | NA
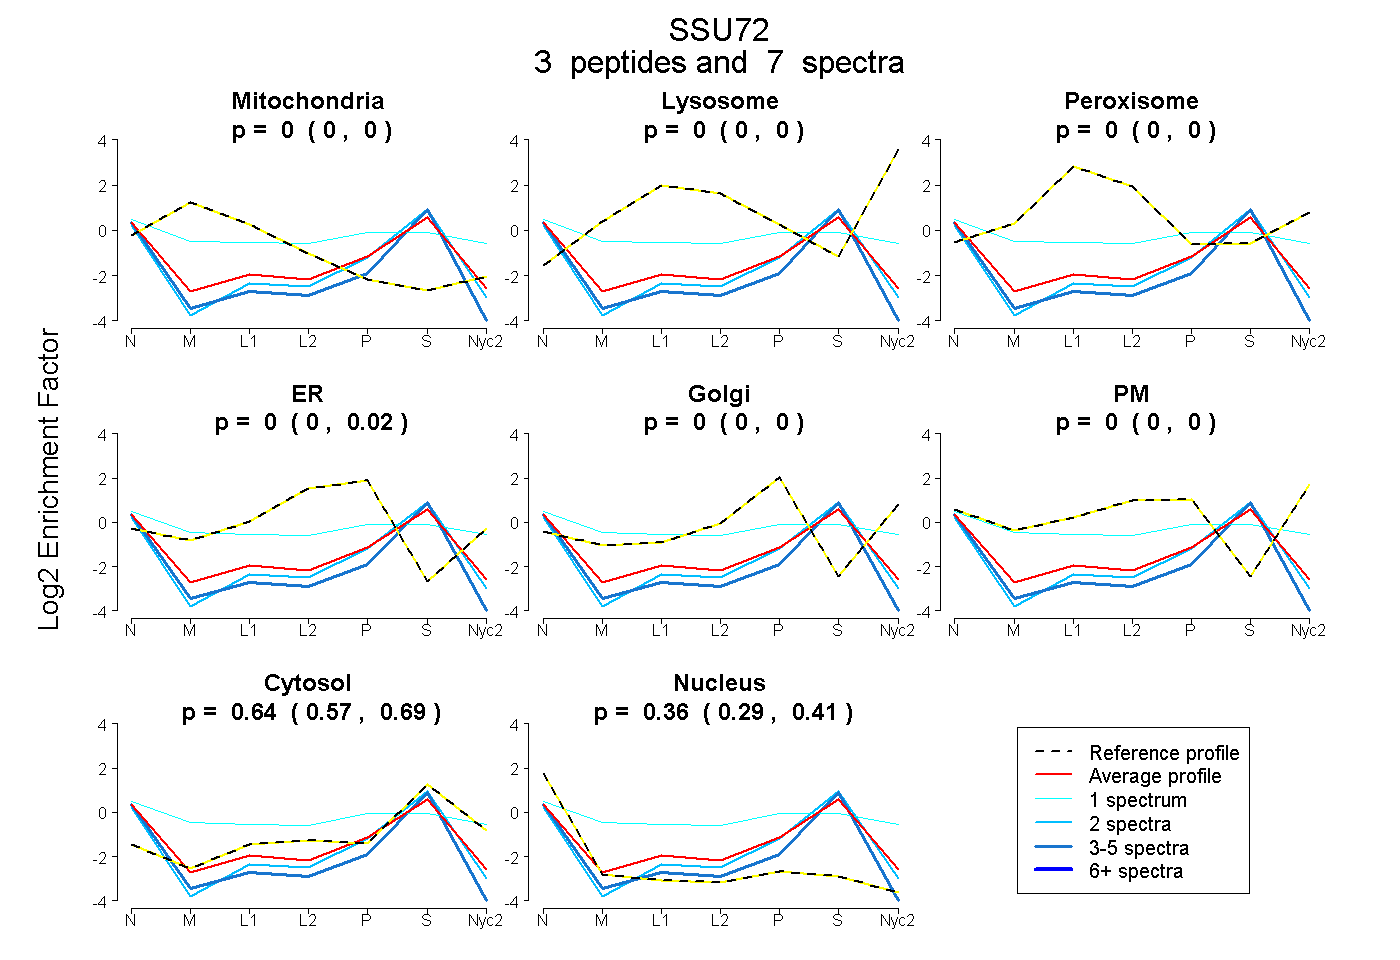
| Plot | Mito | Lyso | Perox | ER | Golgi | PM | Cytosol | Nucleus | |||||
| Expt A |
3 peptides |
7 spectra |
|
0.000 0.000 | 0.000 |
0.000 0.000 | 0.000 |
0.000 0.000 | 0.000 |
0.000 0.000 | 0.019 |
0.000 0.000 | 0.003 |
0.000 0.000 | 0.000 |
0.639 0.569 | 0.686 |
0.361 0.293 | 0.414 |
||
| Plot | Mito | Lyso or Perox | ER | Golgi | PM | Cytosol | Nucleus | ||||||
| Expt B |
1 peptide |
1 spectrum |
|
0.015 NA | NA |
0.177 NA | NA |
0.000 NA | NA |
0.000 NA | NA |
0.321 NA | NA |
0.429 NA | NA |
0.059 NA | NA |