 4
4peptides
spectra
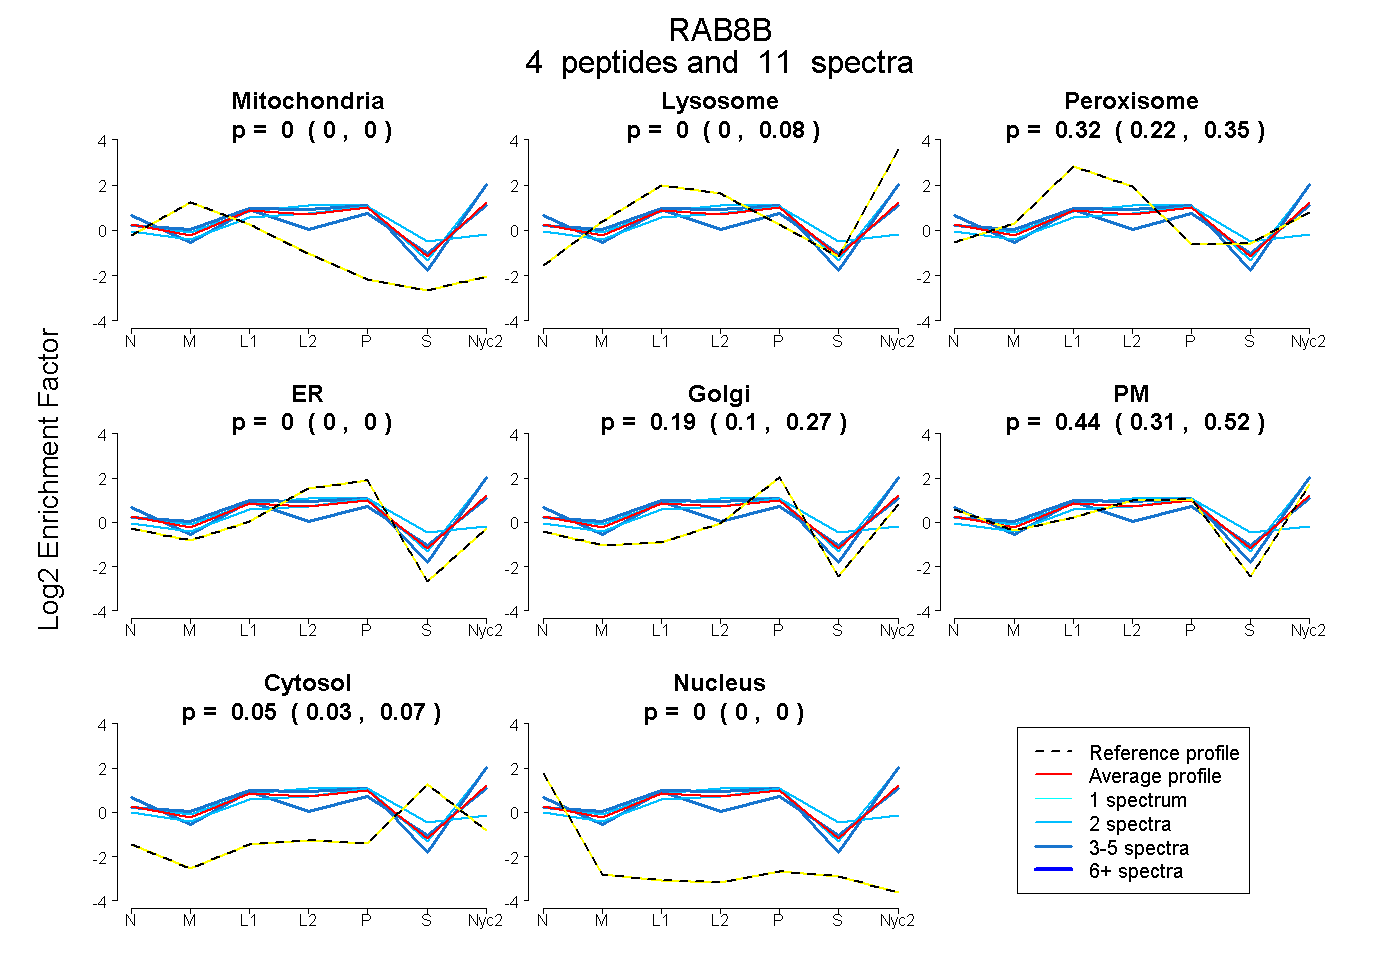
0.000 | 0.000
0.000 | 0.078
0.220 | 0.355
0.000 | 0.000
0.098 | 0.266
0.309 | 0.523
0.028 | 0.072
0.000 | 0.000
| Plot | Mito | Lyso | Perox | ER | Golgi | PM | Cytosol | Nucleus | |||||
| Expt A |
4 peptides |
11 spectra |
|
0.000 0.000 | 0.000 |
0.003 0.000 | 0.078 |
0.315 0.220 | 0.355 |
0.000 0.000 | 0.000 |
0.192 0.098 | 0.266 |
0.440 0.309 | 0.523 |
0.050 0.028 | 0.072 |
0.000 0.000 | 0.000 |
| 2 spectra, FLETSAK | 0.000 | 0.203 | 0.124 | 0.000 | 0.029 | 0.621 | 0.024 | 0.000 | ||
| 4 spectra, SSTNVEEAFFTLAR | 0.000 | 0.206 | 0.091 | 0.000 | 0.019 | 0.683 | 0.000 | 0.000 | ||
| 2 spectra, TCLLFR | 0.000 | 0.000 | 0.328 | 0.334 | 0.145 | 0.000 | 0.192 | 0.000 | ||
| 3 spectra, NIEEHASSDVER | 0.000 | 0.000 | 0.211 | 0.000 | 0.003 | 0.619 | 0.156 | 0.011 |
| Plot | Lyso | Other | |||||||||||
| Expt C |
5 peptides |
17 spectra |
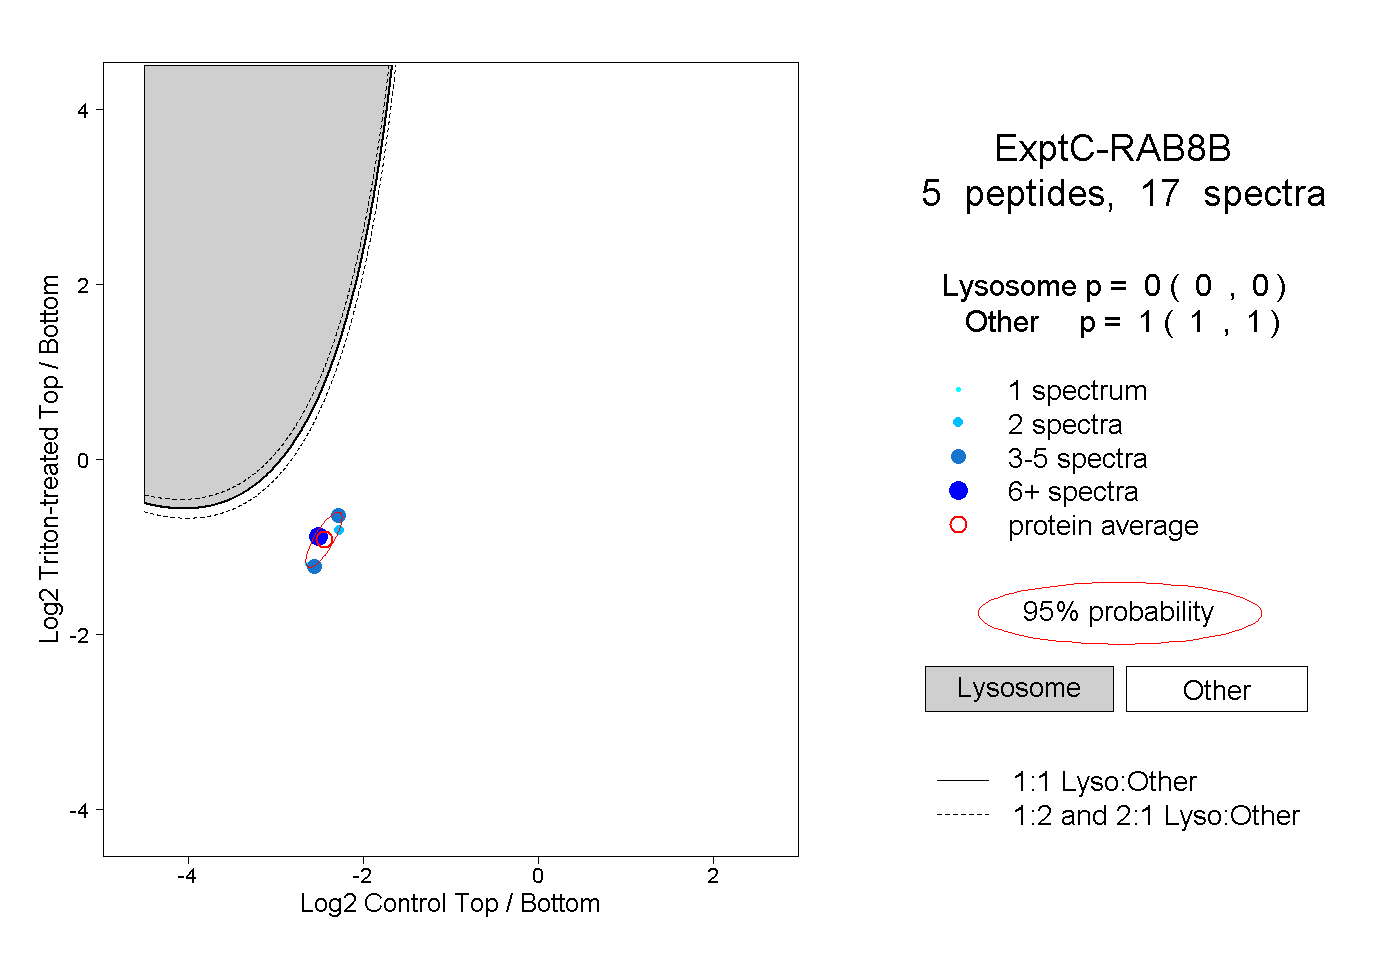 |
0.000 0.000 | 0.000 |
1.000 1.000 | 1.000 |