SLCO2B1
[ENSRNOP00000024281]
Main page
| | | Plot |
Mito |
Lyso |
|
Perox |
ER |
Golgi |
PM |
Cytosol |
Nucleus |
|
| Expt A |
 11
11
peptides |
31
spectra |
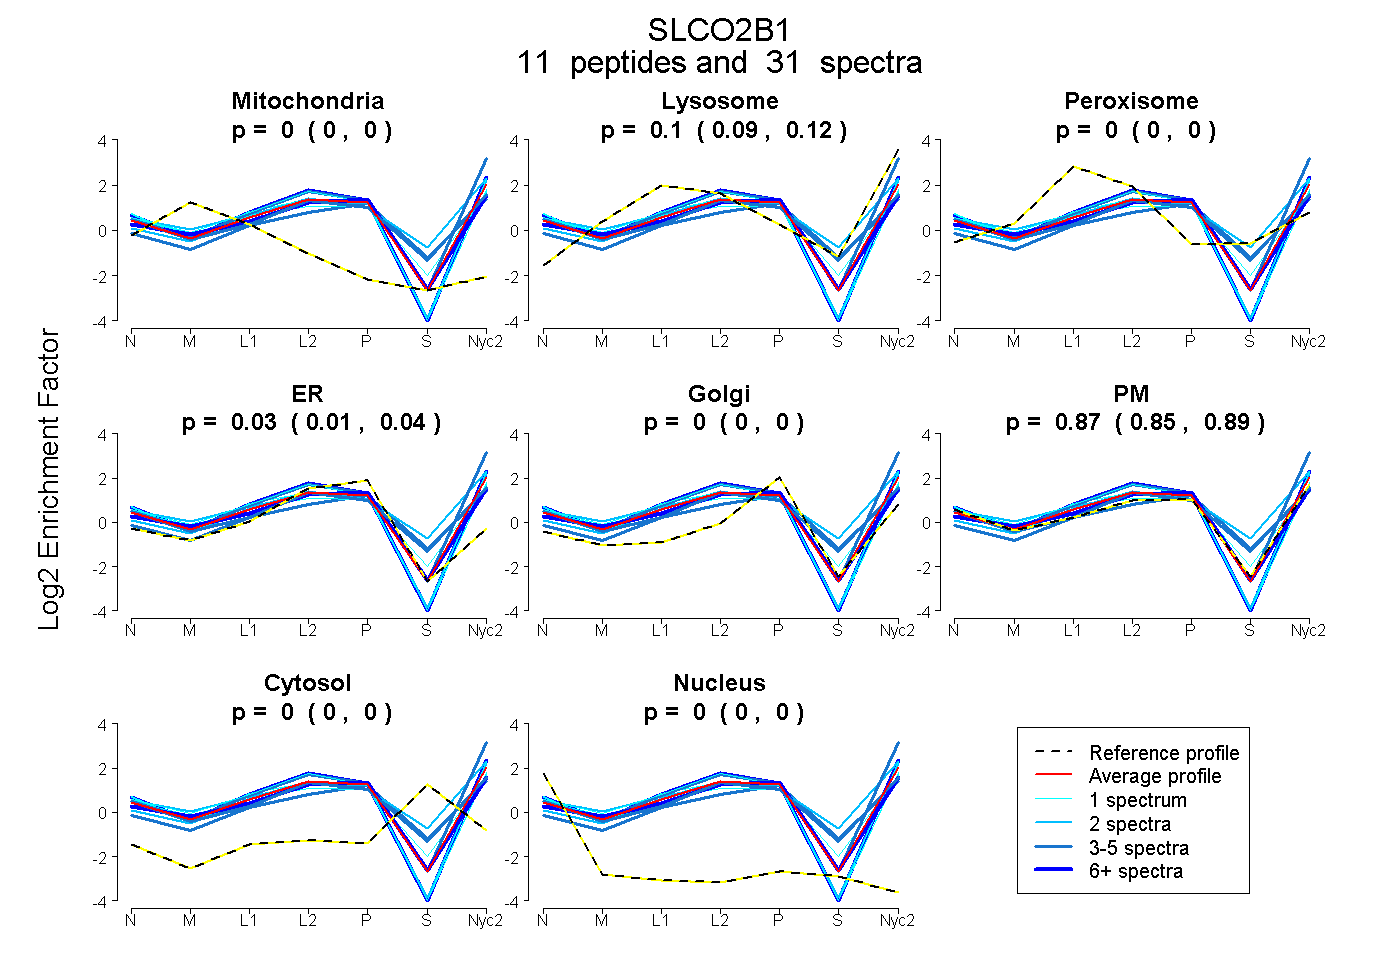 |
0.000
0.000 | 0.000 |
0.102
0.087 | 0.116 |
|
0.000
0.000 | 0.000 |
0.026
0.005 | 0.043 |
0.000
0.000 | 0.000 |
0.872
0.845 | 0.893 |
0.000
0.000 | 0.000 |
0.000
0.000 | 0.000 |
|
| | | Plot |
Mito |
|
Lyso or Perox |
|
ER |
Golgi |
PM |
Cytosol |
Nucleus |
|
| Expt B |
1
peptide |
9
spectra |
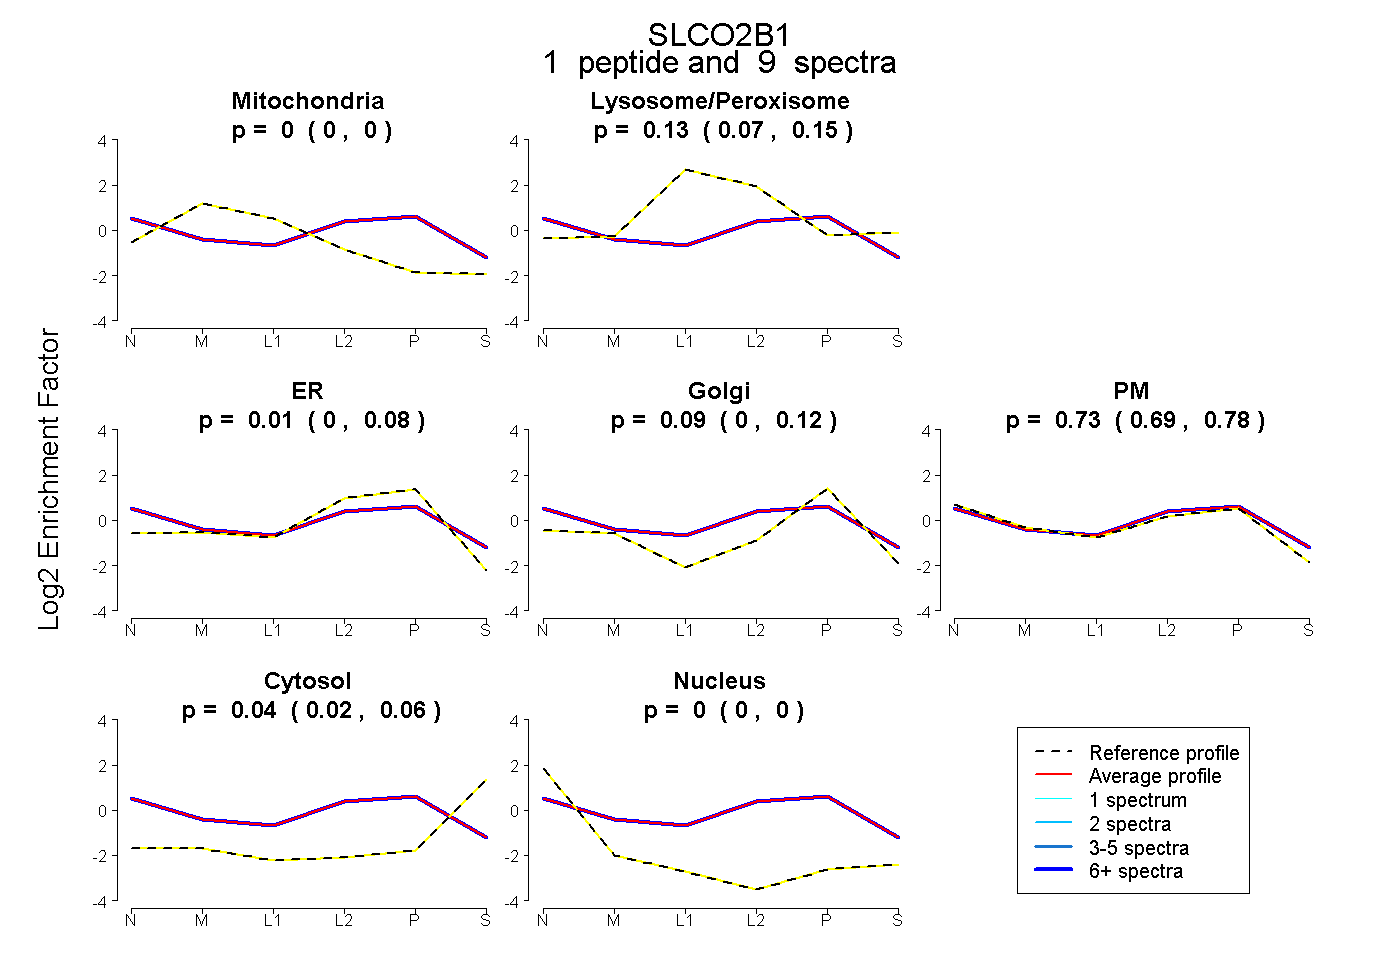 |
0.000
0.000 | 0.000 |
|
0.126
0.070 | 0.148 |
|
0.006
0.000 | 0.080 |
0.092
0.004 | 0.117 |
0.733
0.688 | 0.778 |
0.043
0.024 | 0.065 |
0.000
0.000 | 0.000 |
|
| | | Plot |
|
Lyso |
|
|
|
|
|
|
|
Other |
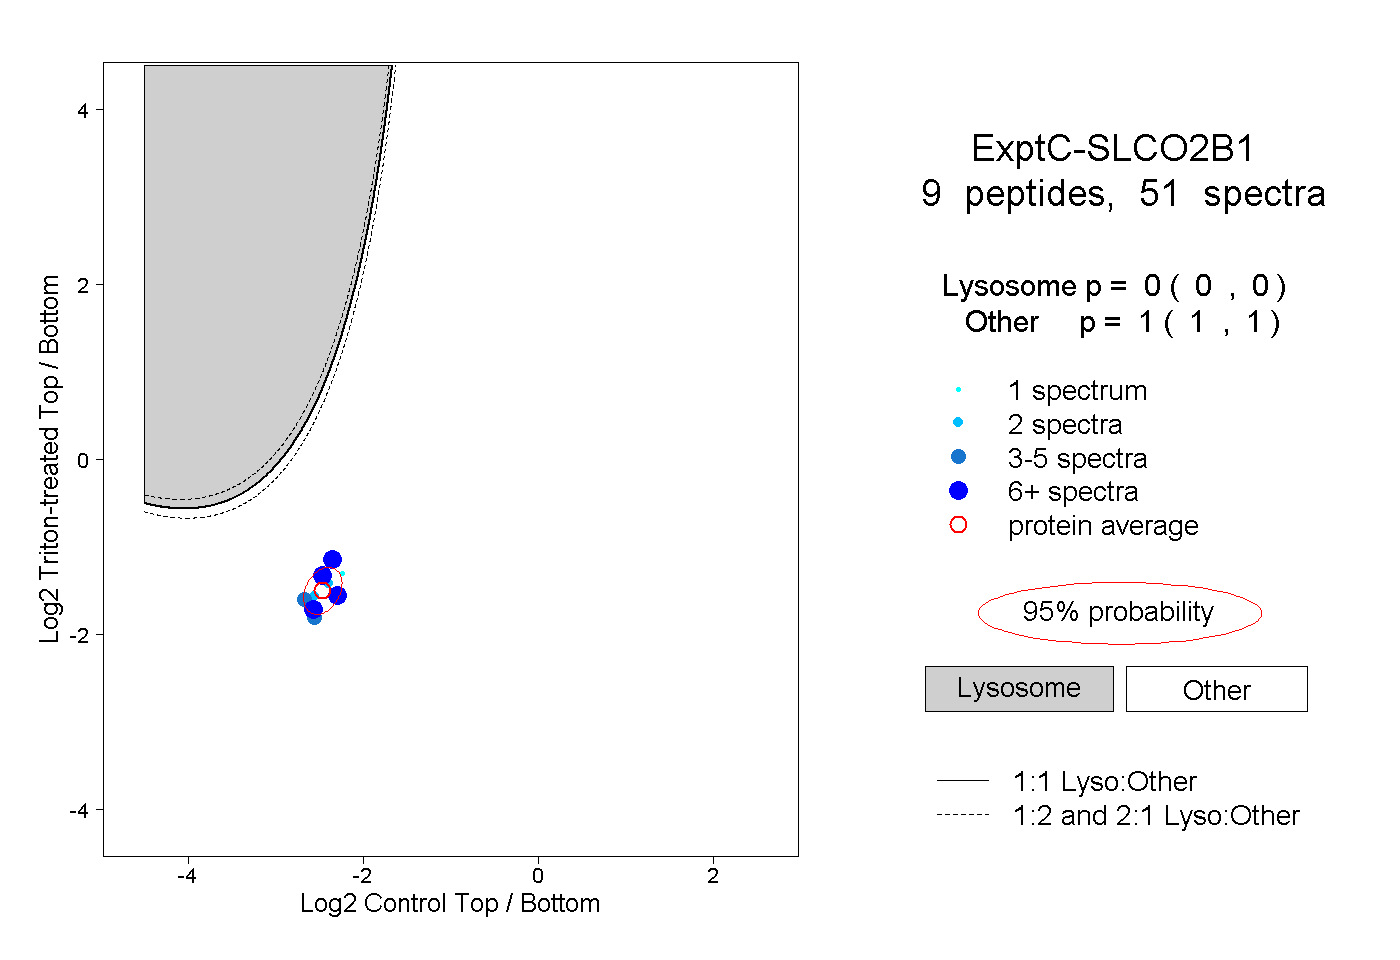
| Expt C |
9
peptides |
51
spectra |
 |
|
0.000
0.000 | 0.000 |
|
|
|
|
|
|
|
1.000
1.000 | 1.000 |
| 5 spectra, LYVDIDR |
|
0.000 |
|
|
|
|
|
|
|
1.000 |
| 5 spectra, ATMGAEDIHER |
|
0.000 |
|
|
|
|
|
|
|
1.000 |
| 6 spectra, SSISTVEK |
|
0.000 |
|
|
|
|
|
|
|
1.000 |
| 9 spectra, VLAGGASIGSK |
|
0.000 |
|
|
|
|
|
|
|
1.000 |
| 2 spectra, MPEGGINLTTK |
|
0.000 |
|
|
|
|
|
|
|
1.000 |
| 10 spectra, YELHFR |
|
0.000 |
|
|
|
|
|
|
|
1.000 |
| 2 spectra, GMFQNIK |
|
0.000 |
|
|
|
|
|
|
|
1.000 |
| 1 spectrum, TLAVGMQFMLLR |
|
0.000 |
|
|
|
|
|
|
|
1.000 |
| 11 spectra, YYDHDLLR |
|
0.000 |
|
|
|
|
|
|
|
1.000 |
| | | Plot |
|
Lyso |
|
|
|
|
|
|
|
Other |
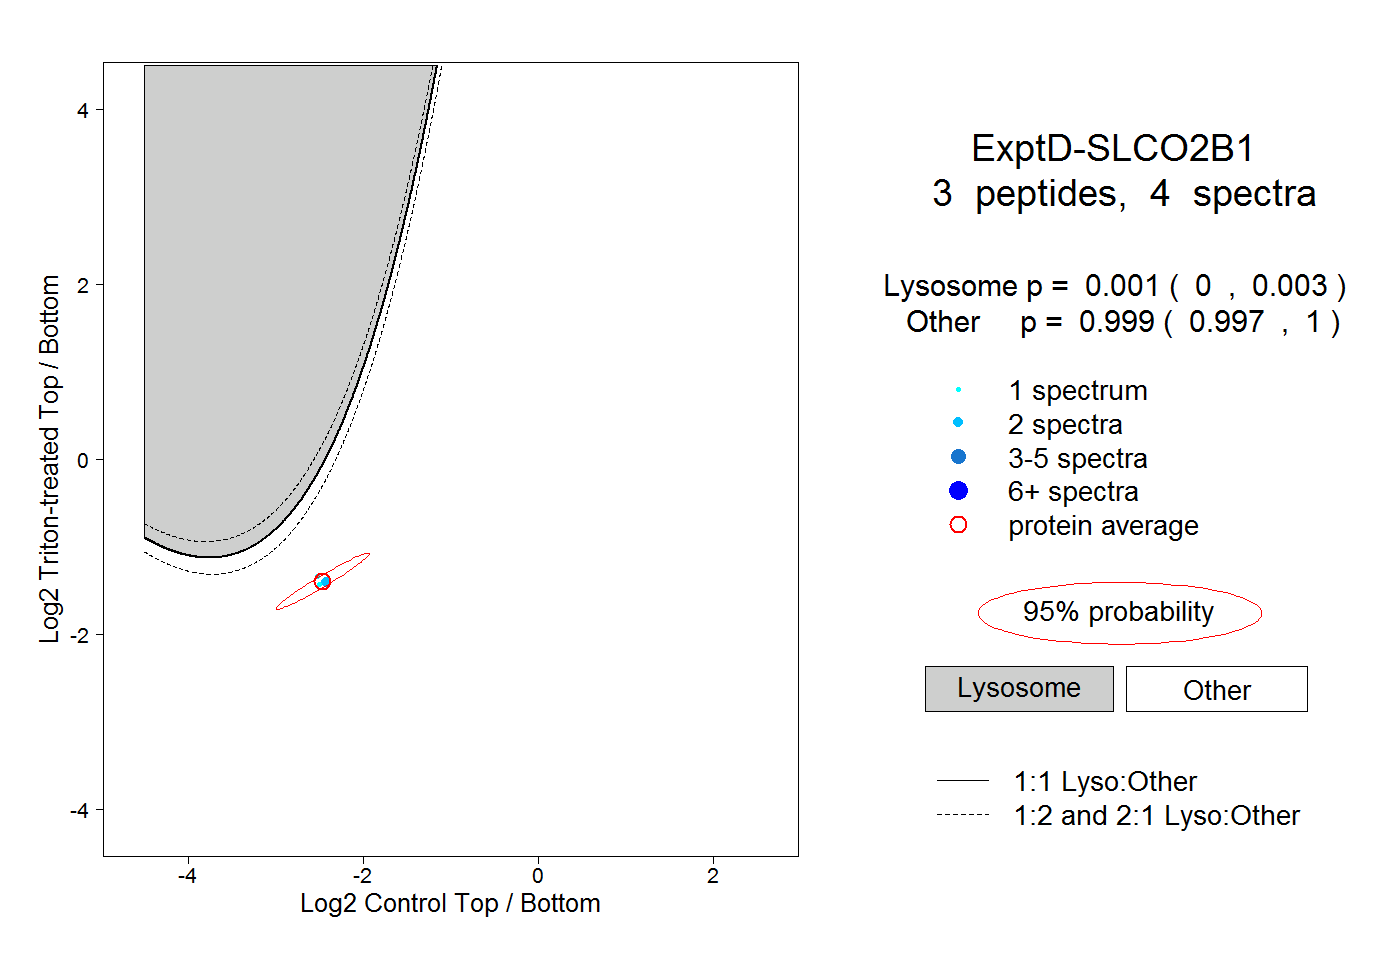
| Expt D |
3
peptides |
4
spectra |
 |
|
0.001
0.000 | 0.003 |
|
|
|
|
|
|
|
0.999
0.997 | 1.000 |