 15
15peptides
spectra
0.000 | 0.000
1.000 | 1.000
0.000 | 0.000
0.000 | 0.000
0.000 | 0.000
0.000 | 0.000
0.000 | 0.000
0.000 | 0.000
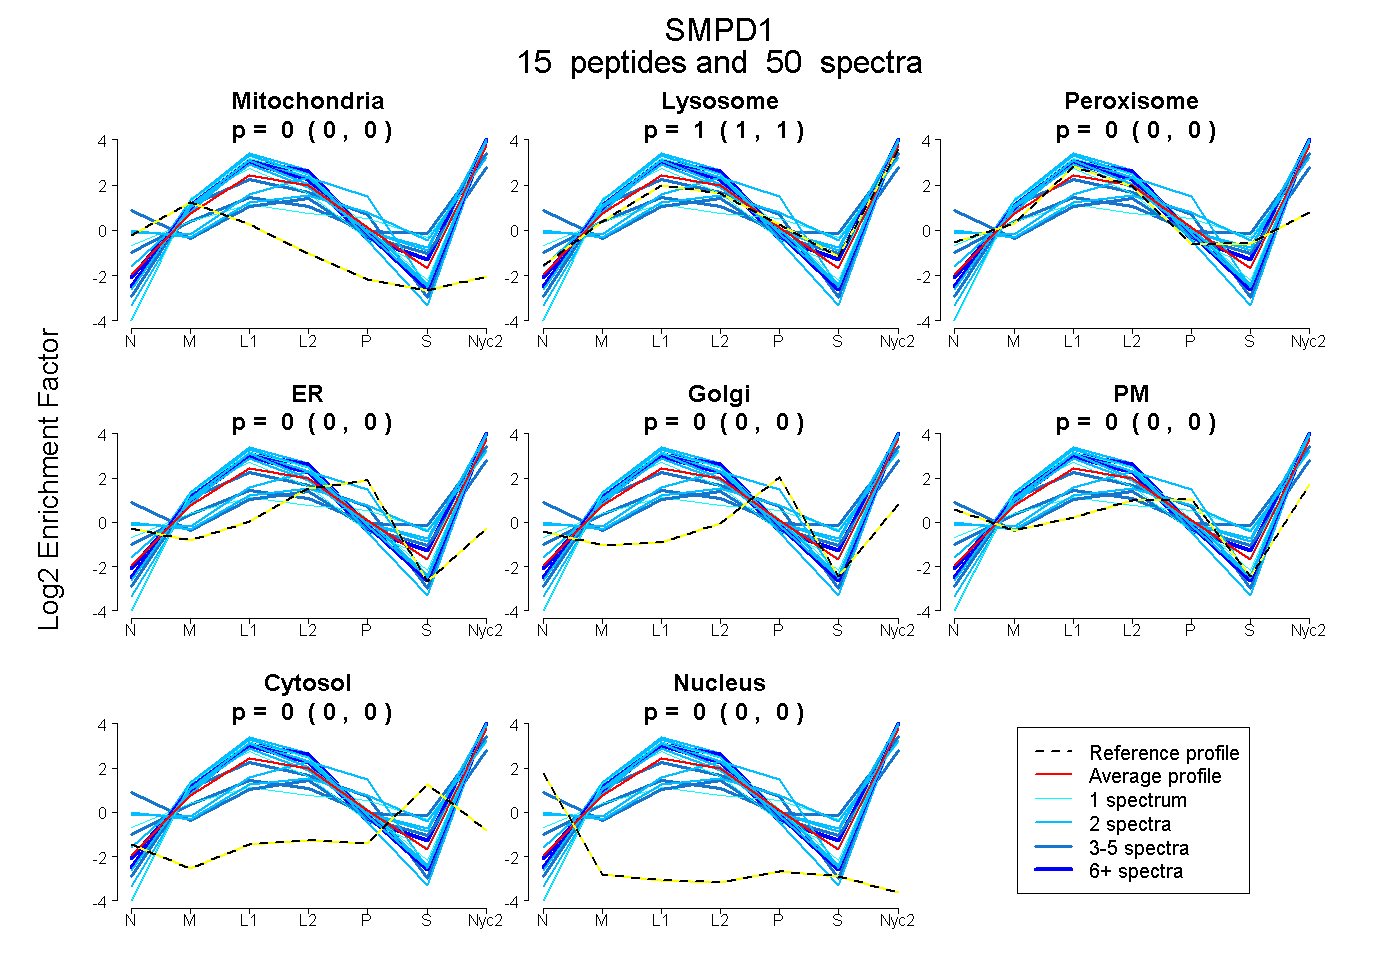
| Plot | Mito | Lyso | Perox | ER | Golgi | PM | Cytosol | Nucleus | |||||
| Expt A |
15 peptides |
50 spectra |
|
0.000 0.000 | 0.000 |
1.000 1.000 | 1.000 |
0.000 0.000 | 0.000 |
0.000 0.000 | 0.000 |
0.000 0.000 | 0.000 |
0.000 0.000 | 0.000 |
0.000 0.000 | 0.000 |
0.000 0.000 | 0.000 |
| 2 spectra, SWSWNYYK | 0.000 | 1.000 | 0.000 | 0.000 | 0.000 | 0.000 | 0.000 | 0.000 | ||
| 3 spectra, GHPPSEPCGTPCR | 0.000 | 0.297 | 0.179 | 0.000 | 0.000 | 0.490 | 0.030 | 0.004 | ||
| 10 spectra, LISLNMNFCSR | 0.000 | 1.000 | 0.000 | 0.000 | 0.000 | 0.000 | 0.000 | 0.000 | ||
| 2 spectra, VLFTALNYGLK | 0.000 | 1.000 | 0.000 | 0.000 | 0.000 | 0.000 | 0.000 | 0.000 | ||
| 1 spectrum, ETYGLPDAMPASWHNLVYR | 0.000 | 0.740 | 0.000 | 0.000 | 0.000 | 0.141 | 0.119 | 0.000 | ||
| 4 spectra, CDLPLR | 0.000 | 0.874 | 0.000 | 0.000 | 0.000 | 0.000 | 0.126 | 0.000 | ||
| 2 spectra, EPNVAR | 0.000 | 0.964 | 0.036 | 0.000 | 0.000 | 0.000 | 0.000 | 0.000 | ||
| 3 spectra, AWEPWLPADALHTLR | 0.000 | 1.000 | 0.000 | 0.000 | 0.000 | 0.000 | 0.000 | 0.000 | ||
| 2 spectra, LATLCAQLSAR | 0.000 | 1.000 | 0.000 | 0.000 | 0.000 | 0.000 | 0.000 | 0.000 | ||
| 2 spectra, TGAGYWGEYSK | 0.000 | 1.000 | 0.000 | 0.000 | 0.000 | 0.000 | 0.000 | 0.000 | ||
| 2 spectra, VHIIGHIPPGHCLK | 0.000 | 0.635 | 0.000 | 0.000 | 0.000 | 0.315 | 0.051 | 0.000 | ||
| 1 spectrum, GLGPAGPFEMVYWTGDIPAHDVWQQSR | 0.000 | 1.000 | 0.000 | 0.000 | 0.000 | 0.000 | 0.000 | 0.000 | ||
| 2 spectra, TLESLLK | 0.000 | 0.597 | 0.000 | 0.000 | 0.000 | 0.403 | 0.000 | 0.000 | ||
| 13 spectra, ADSPALCR | 0.000 | 1.000 | 0.000 | 0.000 | 0.000 | 0.000 | 0.000 | 0.000 | ||
| 1 spectrum, VGSVAIK | 0.000 | 1.000 | 0.000 | 0.000 | 0.000 | 0.000 | 0.000 | 0.000 |
| Plot | Mito | Lyso or Perox | ER | Golgi | PM | Cytosol | Nucleus | ||||||
| Expt B |
11 peptides |
34 spectra |
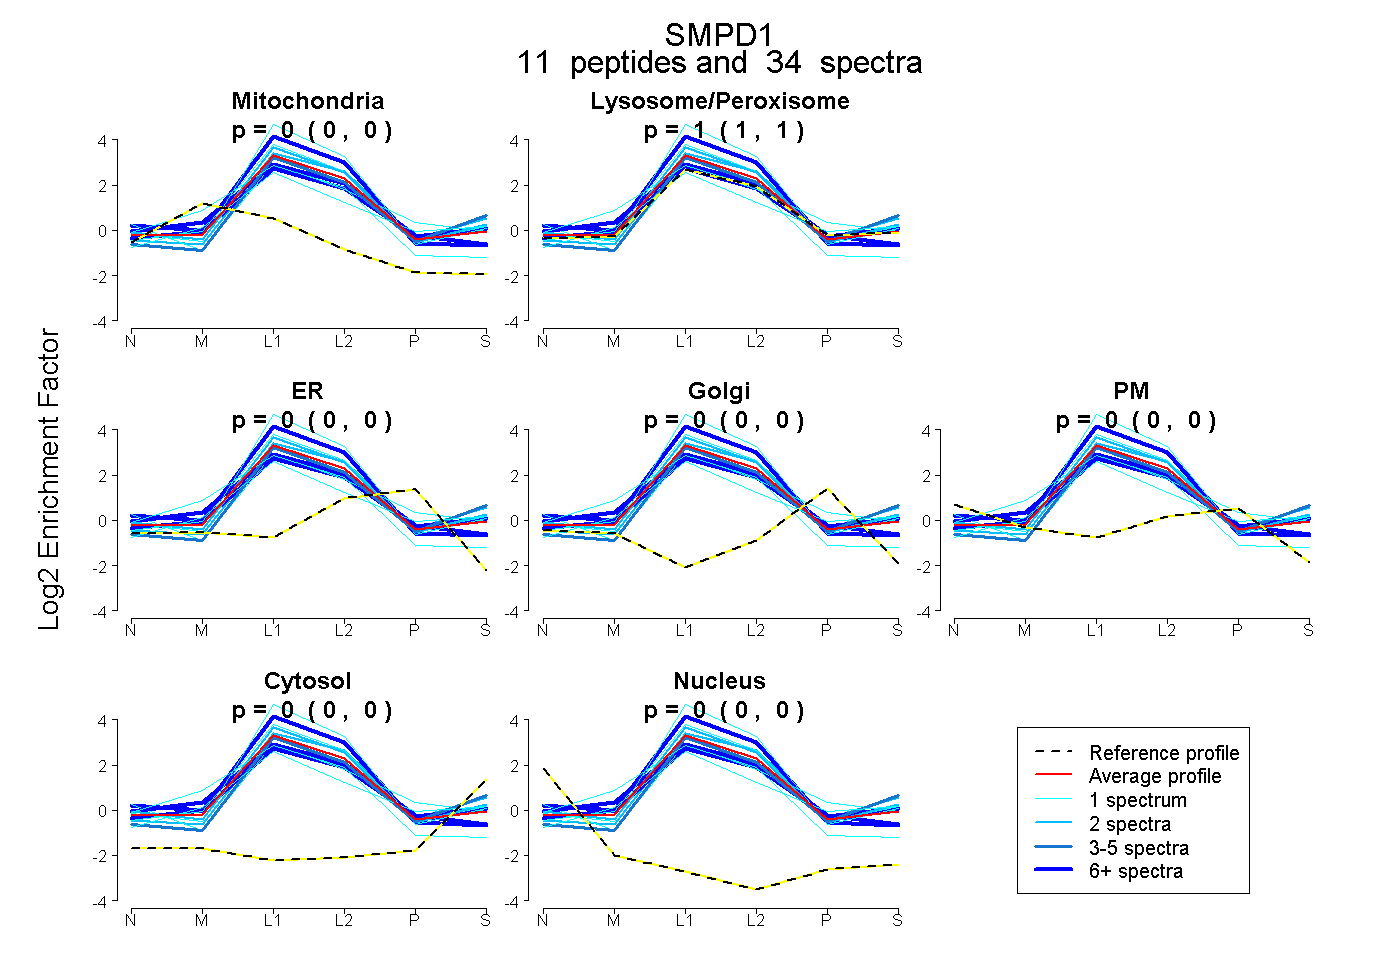 |
0.000 0.000 | 0.000 |
1.000 1.000 | 1.000 |
0.000 0.000 | 0.000 |
0.000 0.000 | 0.000 |
0.000 0.000 | 0.000 |
0.000 0.000 | 0.000 |
0.000 0.000 | 0.000 |
|||
| Plot | Lyso | Other | |||||||||||
| Expt C |
15 peptides |
230 spectra |
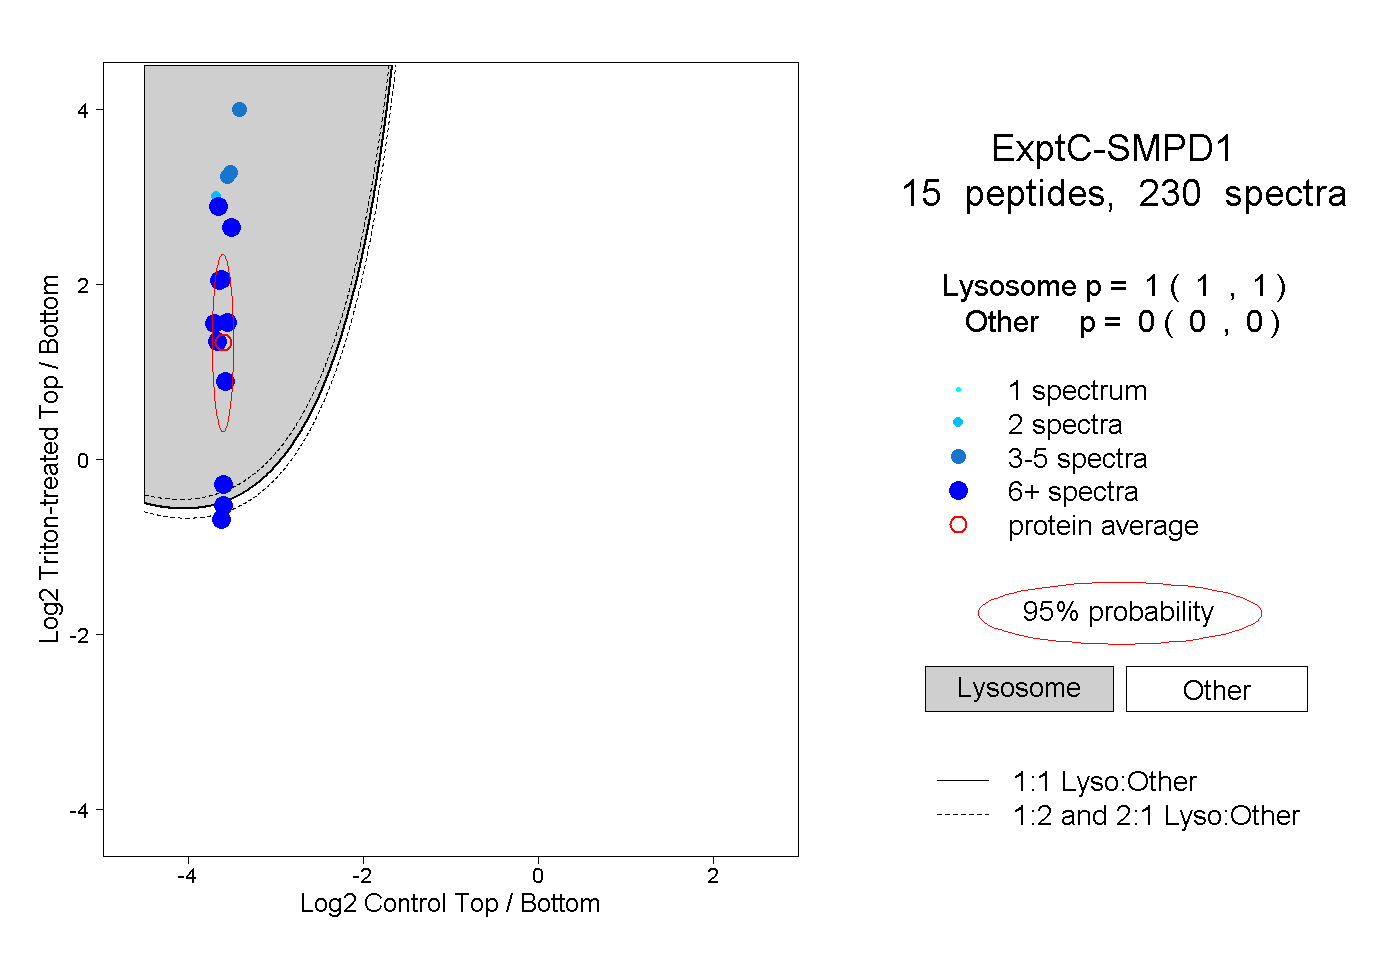 |
1.000 1.000 | 1.000 |
0.000 0.000 | 0.000 |
||||||||
| Plot | Lyso | Other | |||||||||||
| Expt D |
6 peptides |
12 spectra |
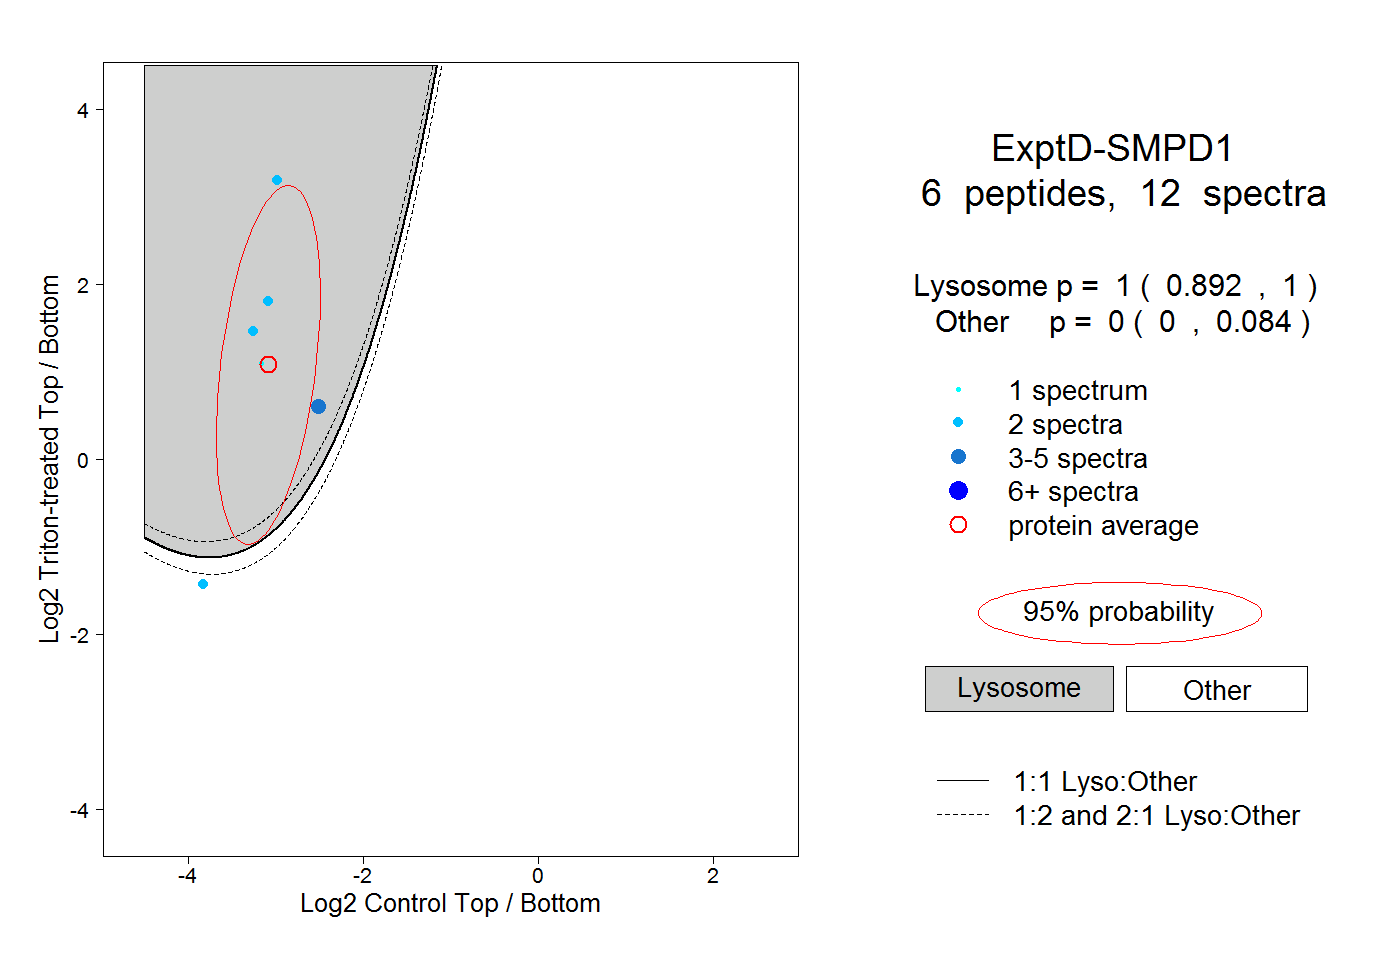 |
1.000 0.892 | 1.000 |
0.000 0.000 | 0.084 |