 4
4peptides
spectra
0.184 | 0.254
0.135 | 0.189
0.000 | 0.000
0.000 | 0.000
0.327 | 0.412
0.204 | 0.239
0.000 | 0.043
| Plot | Mito | Lyso or Perox | ER | Golgi | PM | Cytosol | Nucleus | ||||||
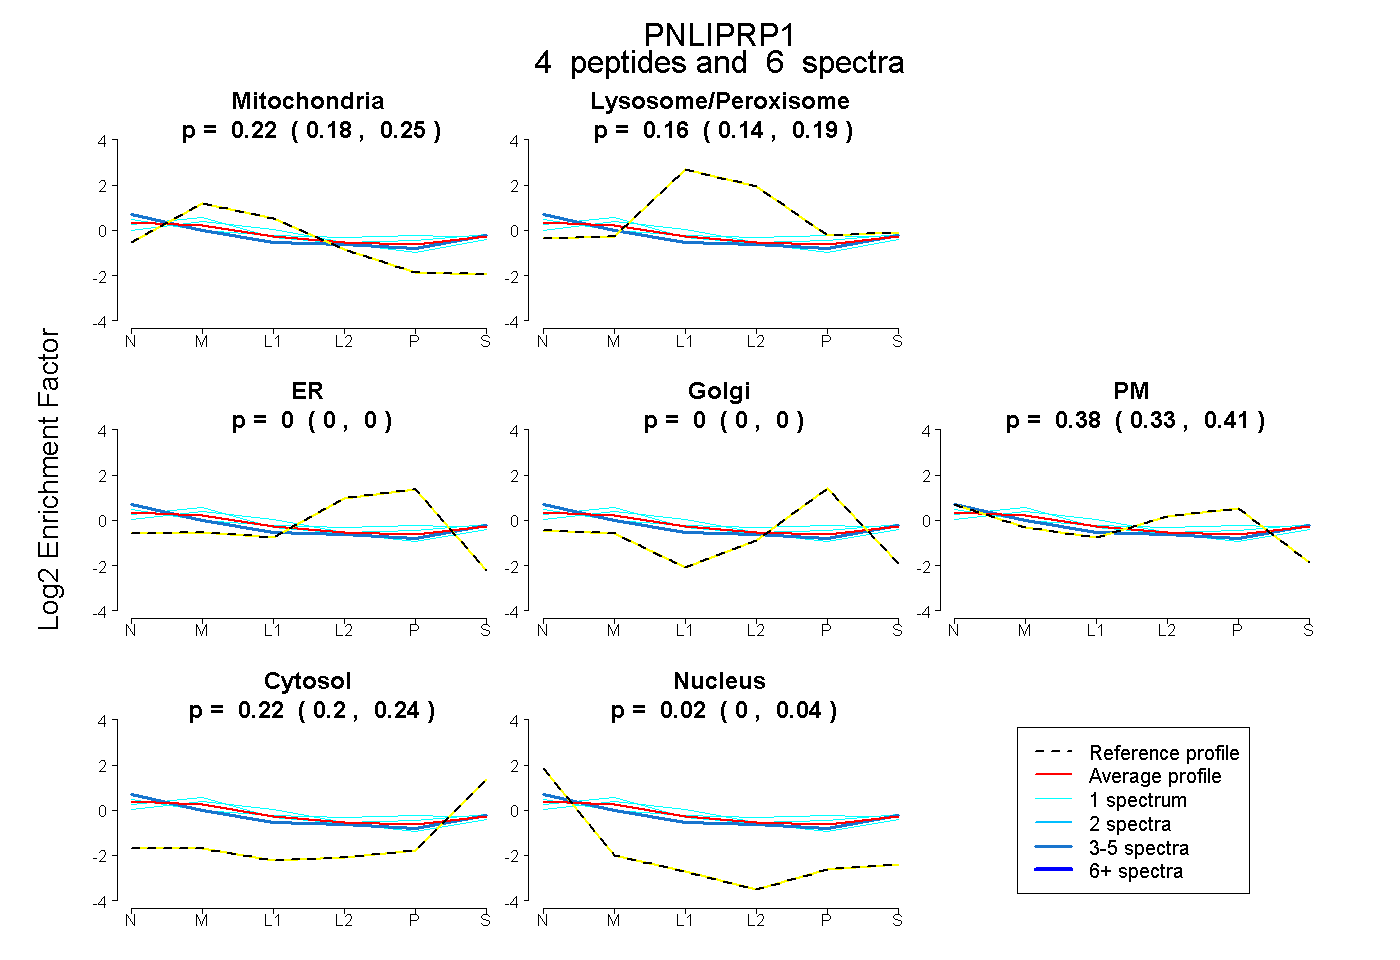
| Expt B |
4 peptides |
6 spectra |
|
0.223 0.184 | 0.254 |
0.161 0.135 | 0.189 |
0.000 0.000 | 0.000 |
0.000 0.000 | 0.000 |
0.376 0.327 | 0.412 |
0.224 0.204 | 0.239 |
0.016 0.000 | 0.043 |
| 1 spectrum, GSQTTYTQAANNVR | 0.381 | 0.100 | 0.000 | 0.000 | 0.307 | 0.212 | 0.000 | |||
| 1 spectrum, DFVACNHLR | 0.254 | 0.214 | 0.000 | 0.000 | 0.302 | 0.231 | 0.000 | |||
| 3 spectra, VSLILSGR | 0.124 | 0.201 | 0.000 | 0.000 | 0.345 | 0.209 | 0.122 | |||
| 1 spectrum, VALFGSK | 0.085 | 0.212 | 0.000 | 0.000 | 0.481 | 0.202 | 0.021 |
| Plot | Lyso | Other | |||||||||||
| Expt C |
4 peptides |
10 spectra |
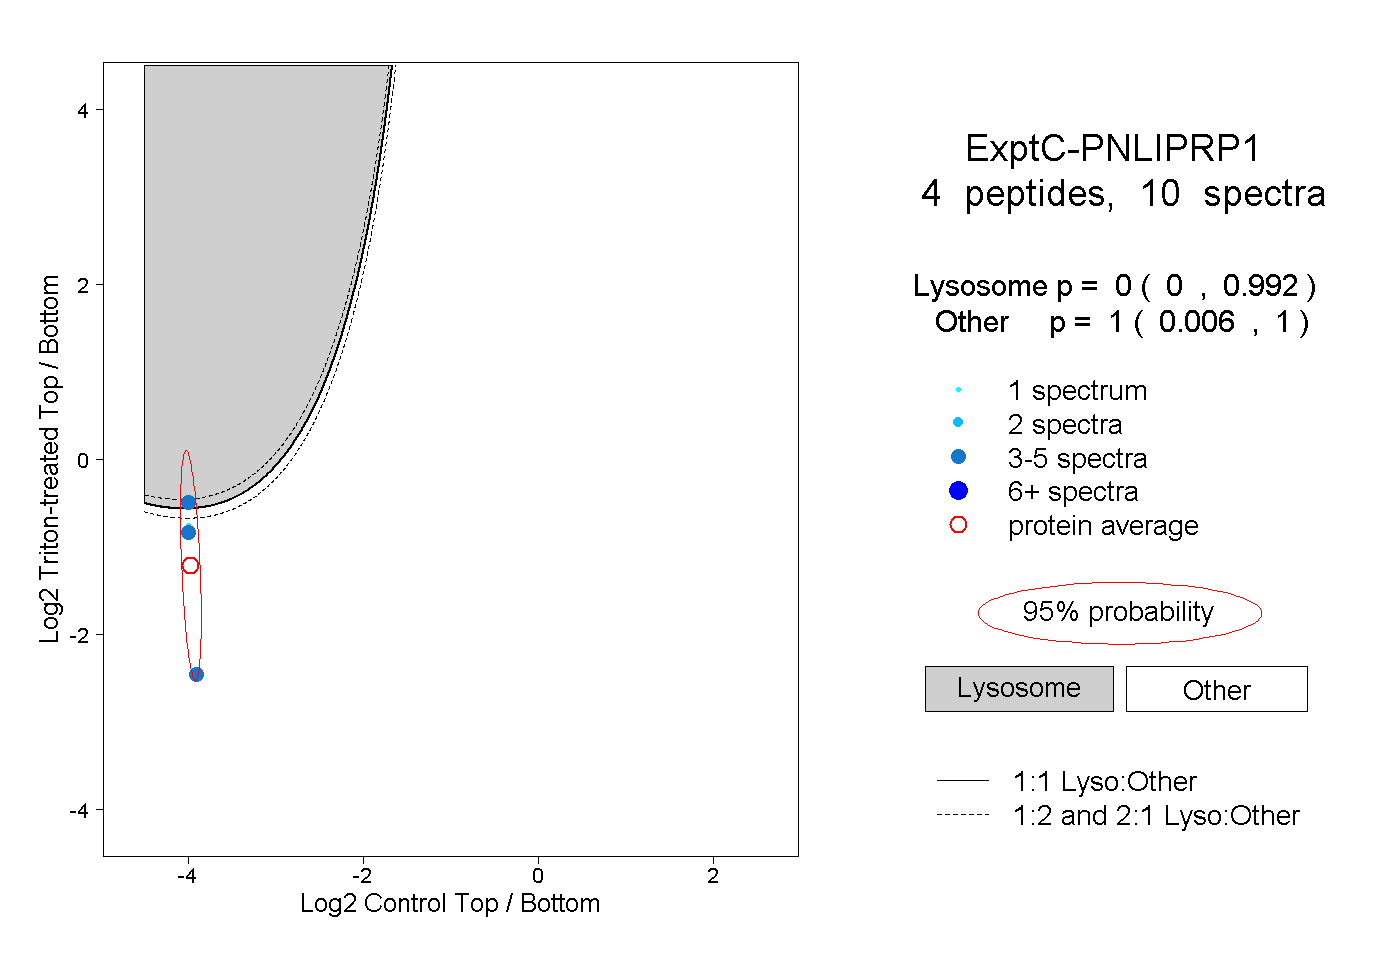 |
0.000 0.000 | 0.992 |
1.000 0.006 | 1.000 |