 7
7peptides
spectra
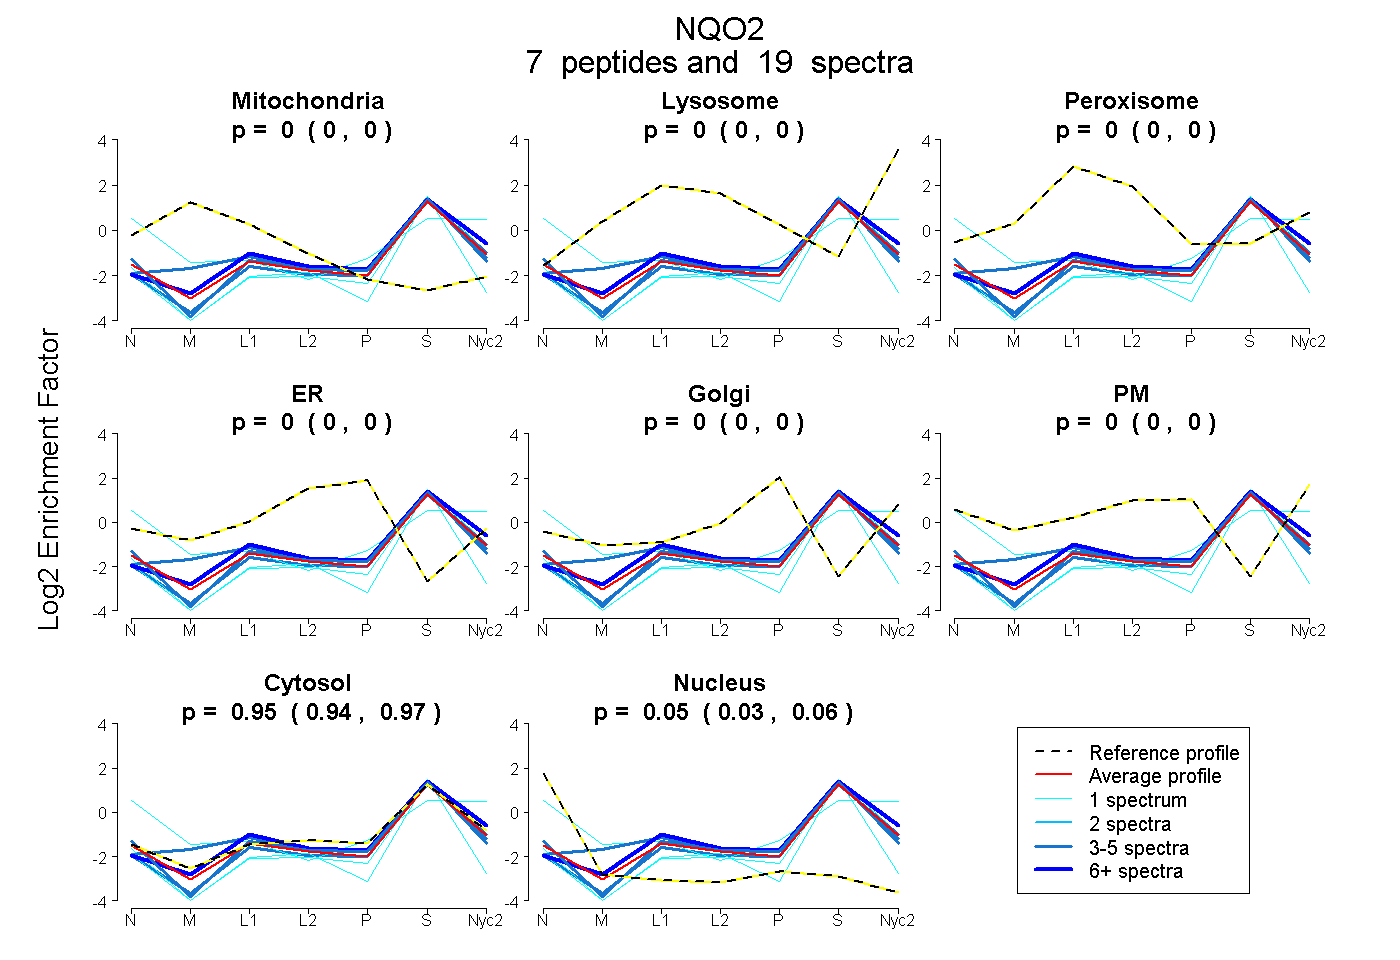
0.000 | 0.000
0.000 | 0.000
0.000 | 0.000
0.000 | 0.000
0.000 | 0.000
0.000 | 0.000
0.938 | 0.966
0.031 | 0.060
3peptides
spectra
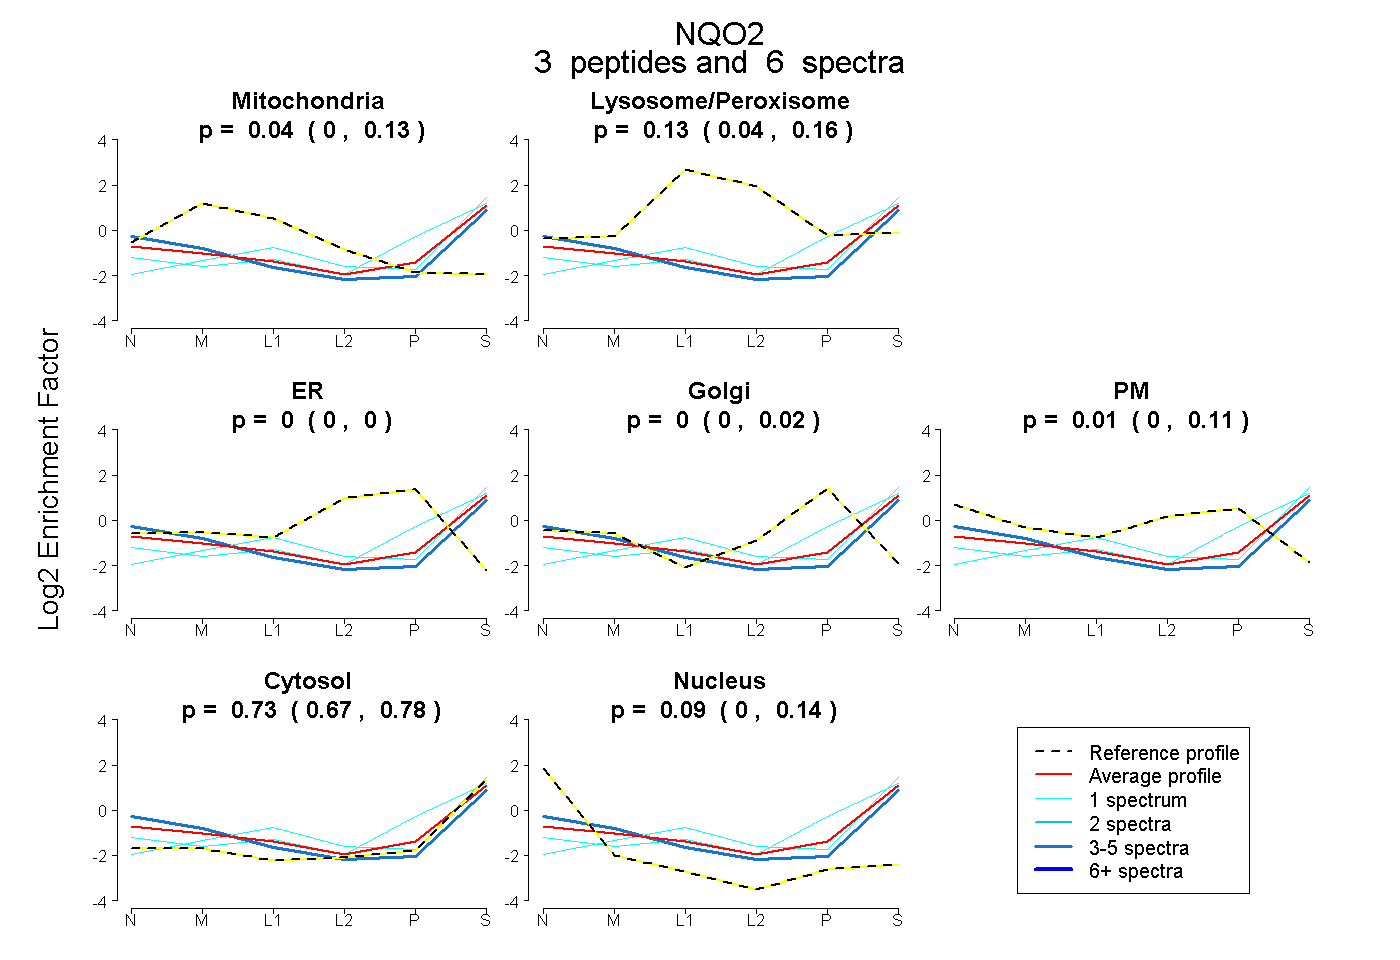
0.000 | 0.132
0.041 | 0.163
0.000 | 0.000
0.000 | 0.021
0.000 | 0.115
0.674 | 0.785
0.000 | 0.139
4peptides
spectra
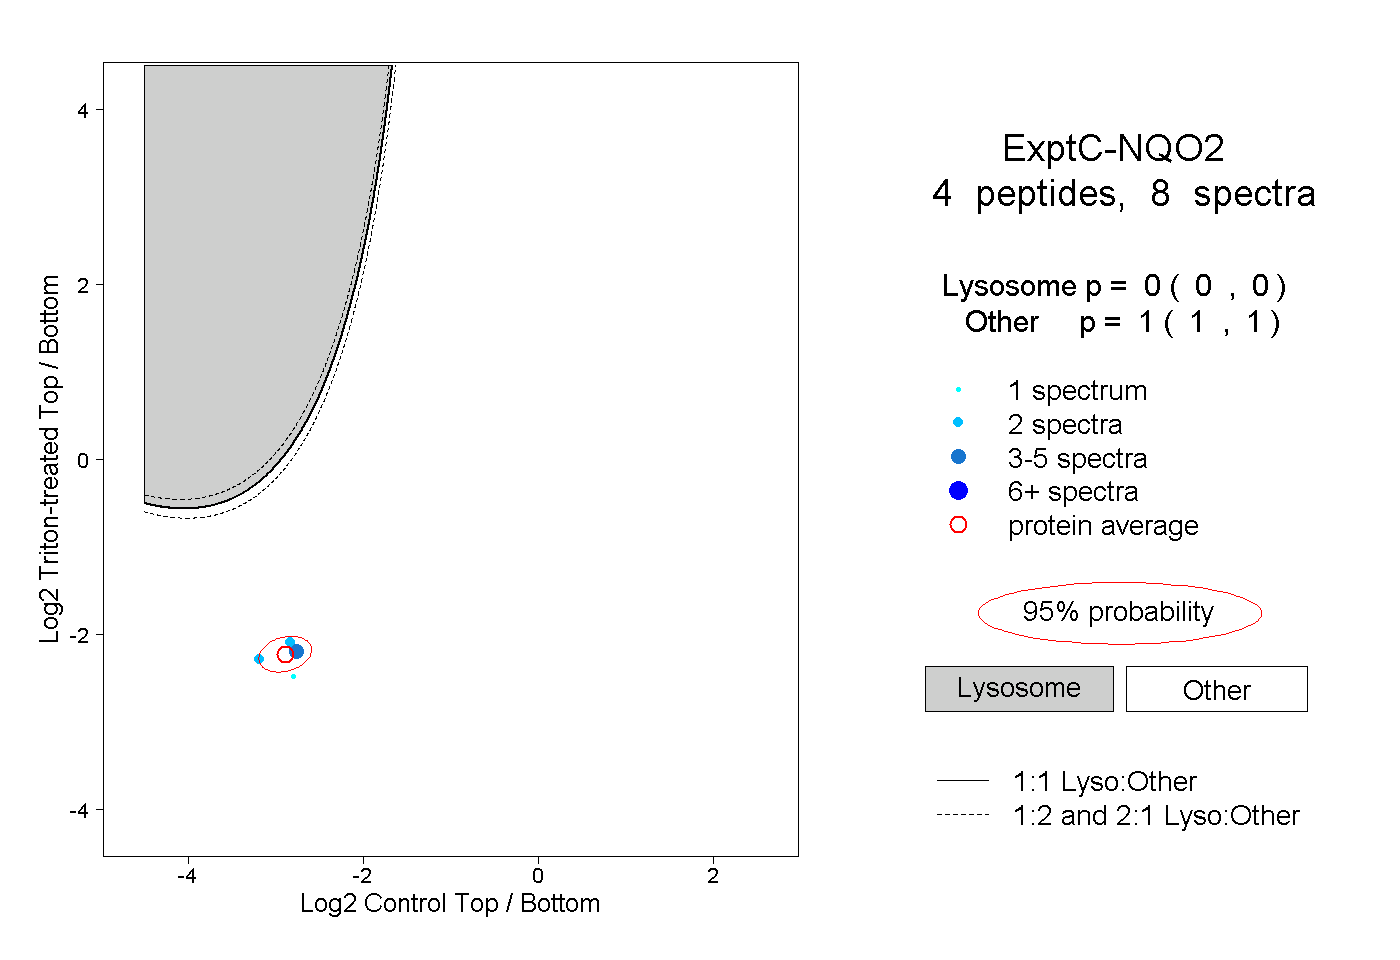
0.000 | 0.000
1.000 | 1.000