 1
1peptide
spectra
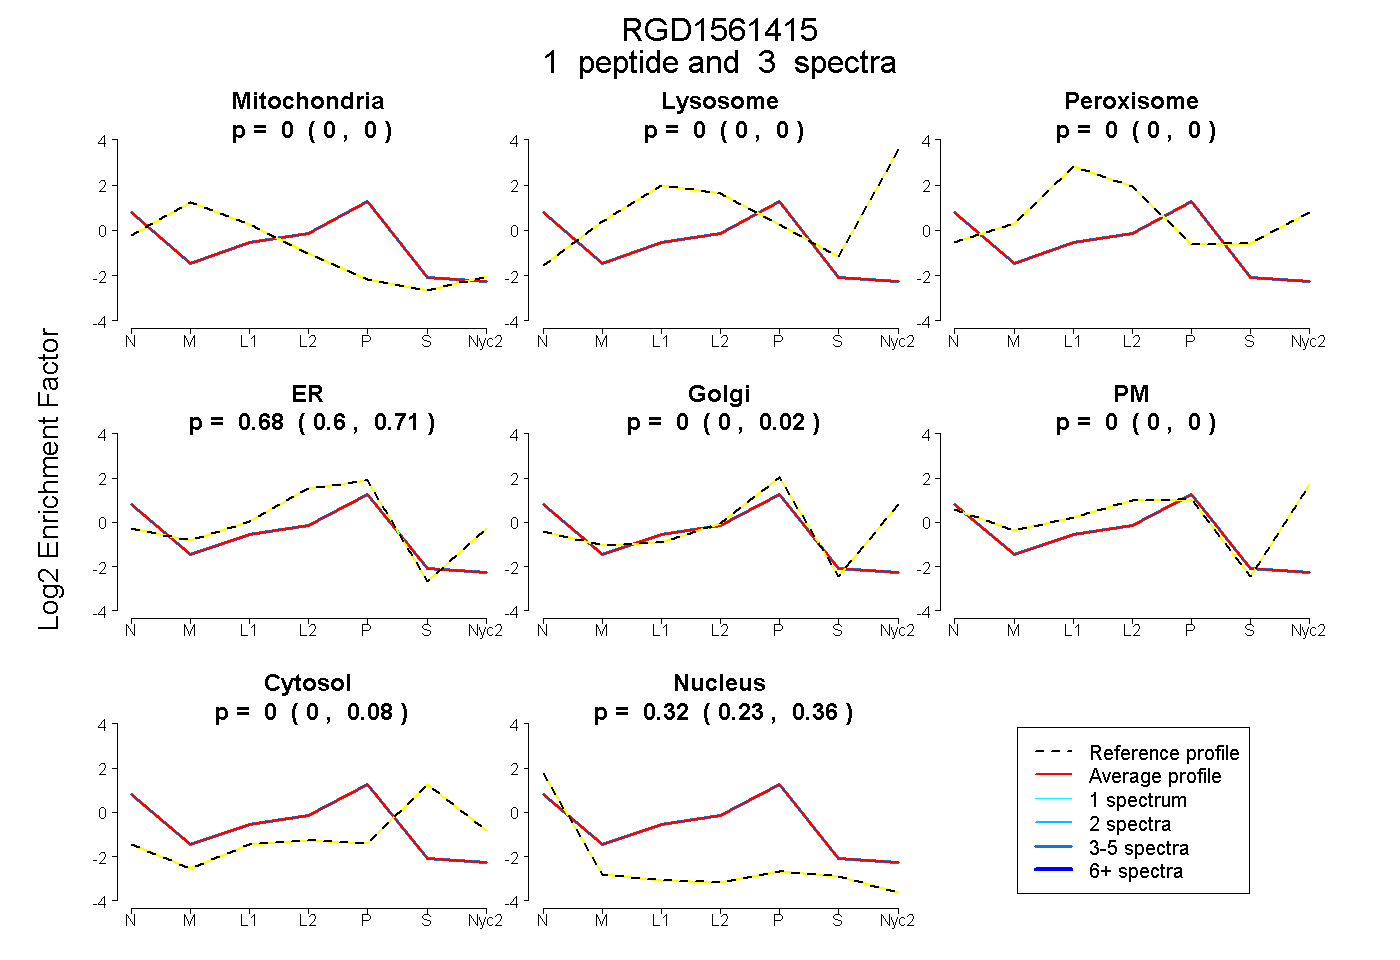
0.000 | 0.000
0.000 | 0.000
0.000 | 0.002
0.604 | 0.713
0.000 | 0.017
0.000 | 0.000
0.000 | 0.083
0.228 | 0.355
1peptide
spectrum
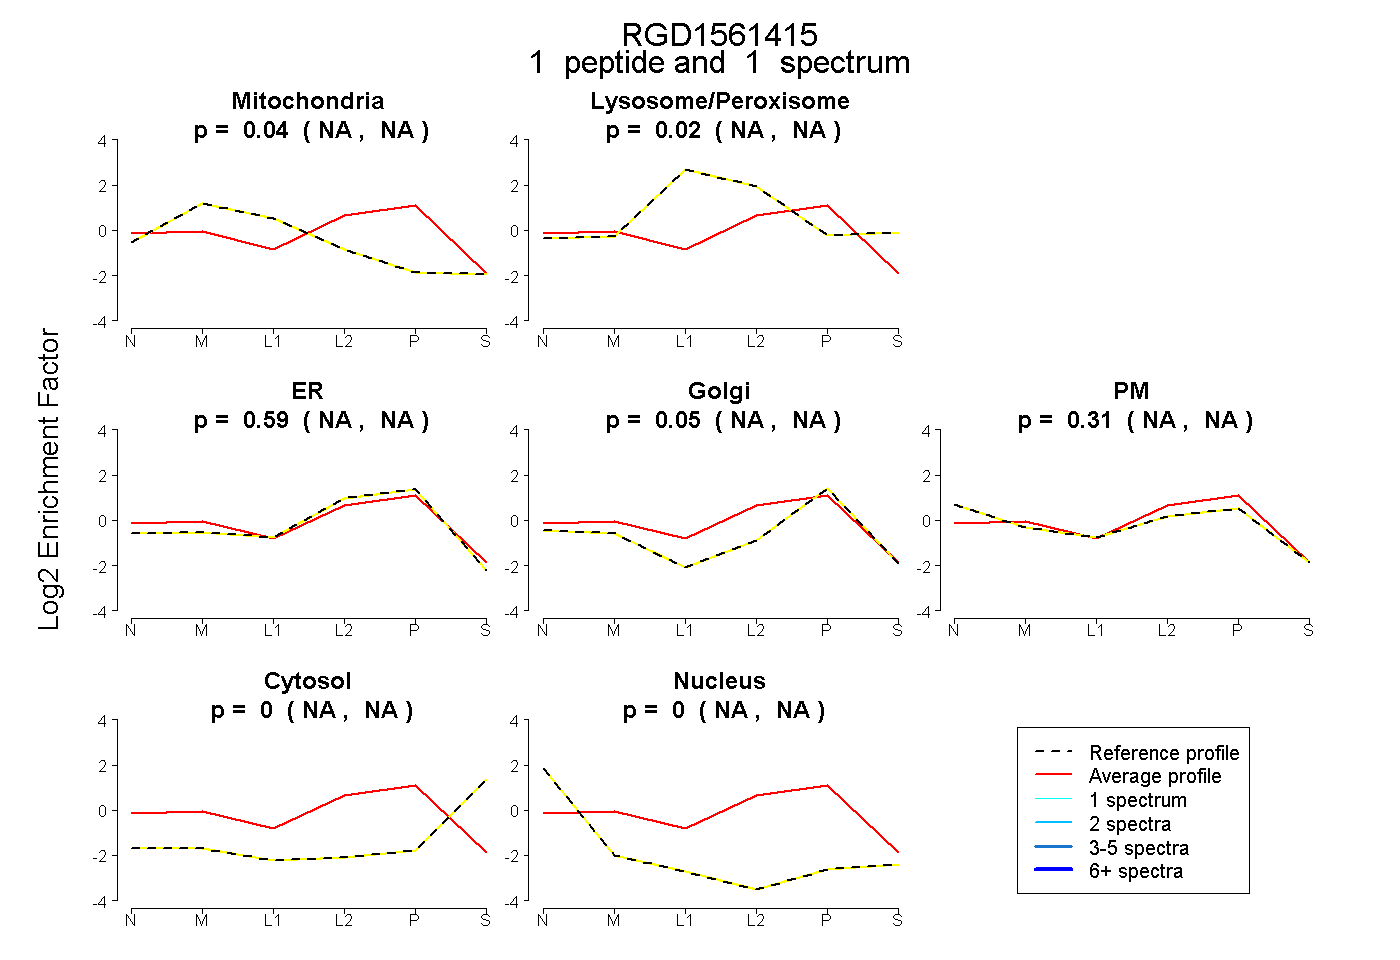
NA | NA
NA | NA
NA | NA
NA | NA
NA | NA
NA | NA
NA | NA
2peptides
spectra
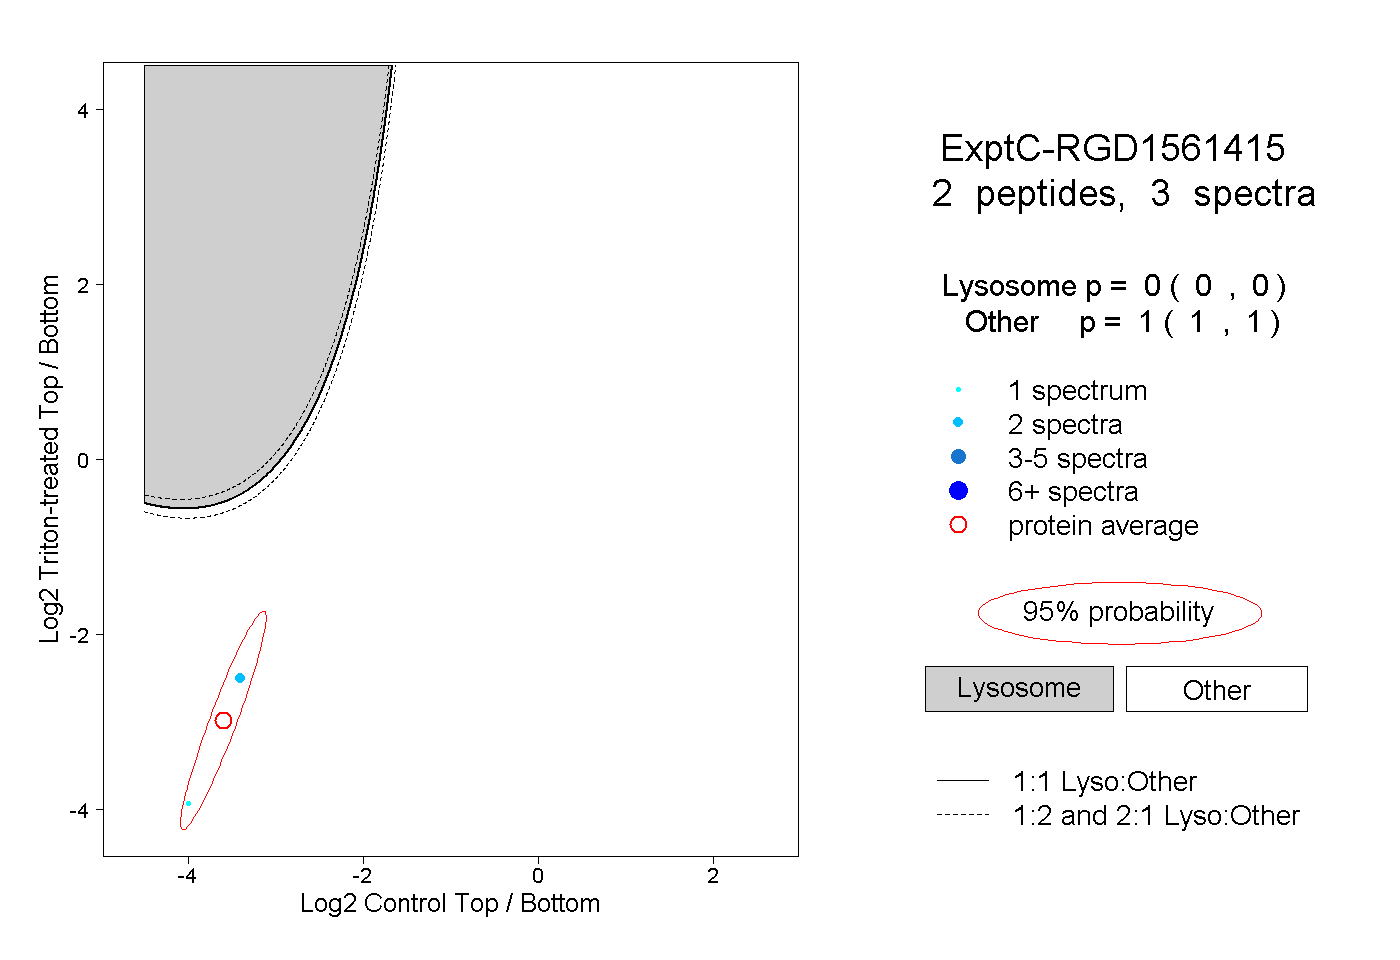
0.000 | 0.000
1.000 | 1.000