 5
5peptides
spectra
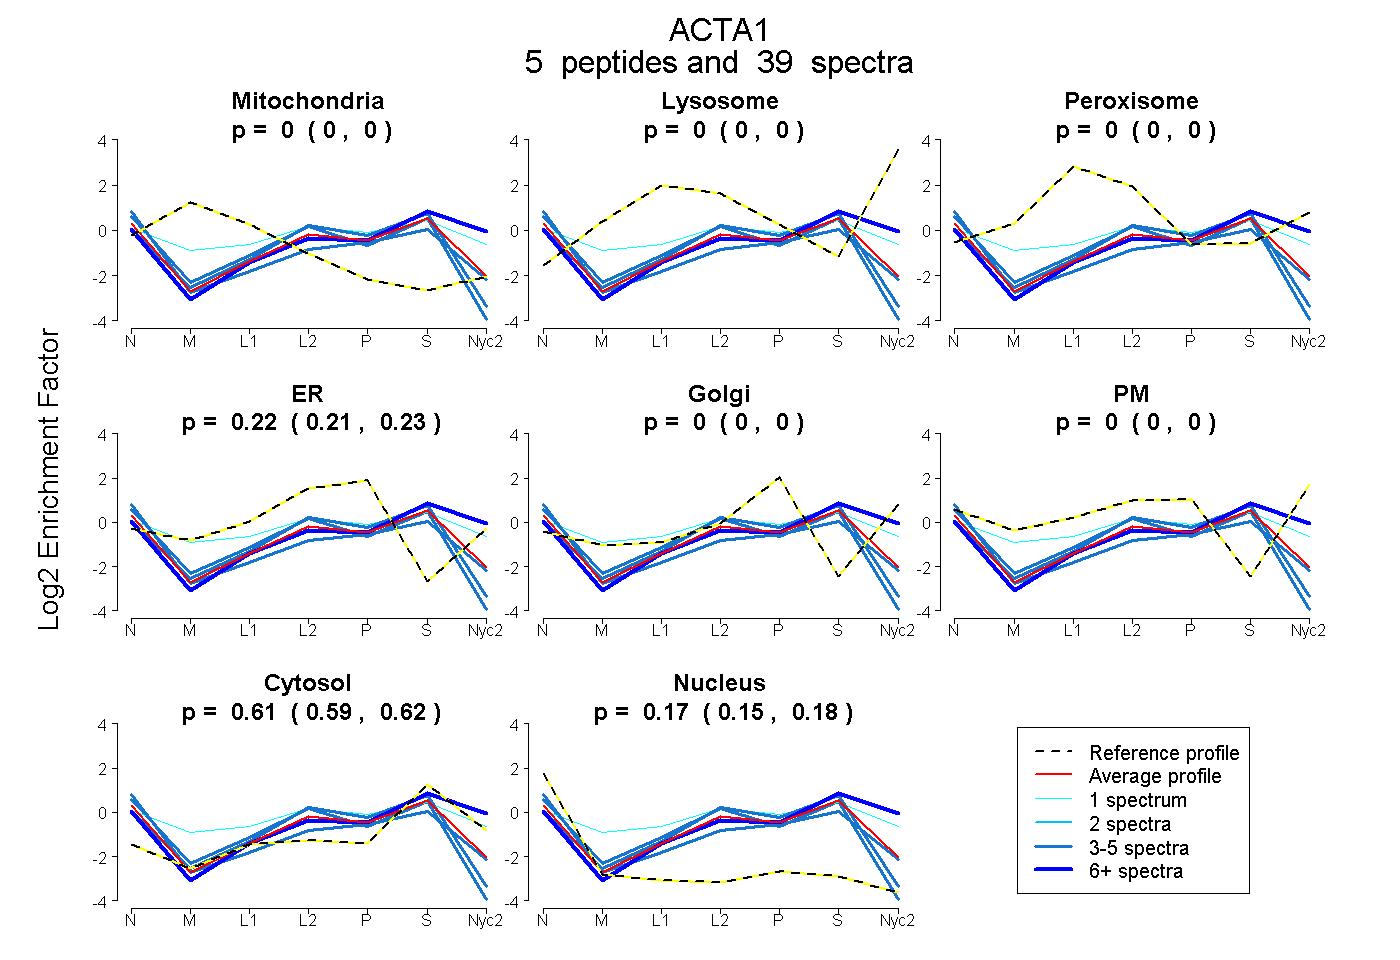
0.000 | 0.000
0.000 | 0.000
0.000 | 0.000
0.212 | 0.230
0.000 | 0.000
0.000 | 0.000
0.595 | 0.621
0.152 | 0.184
2peptides
spectra
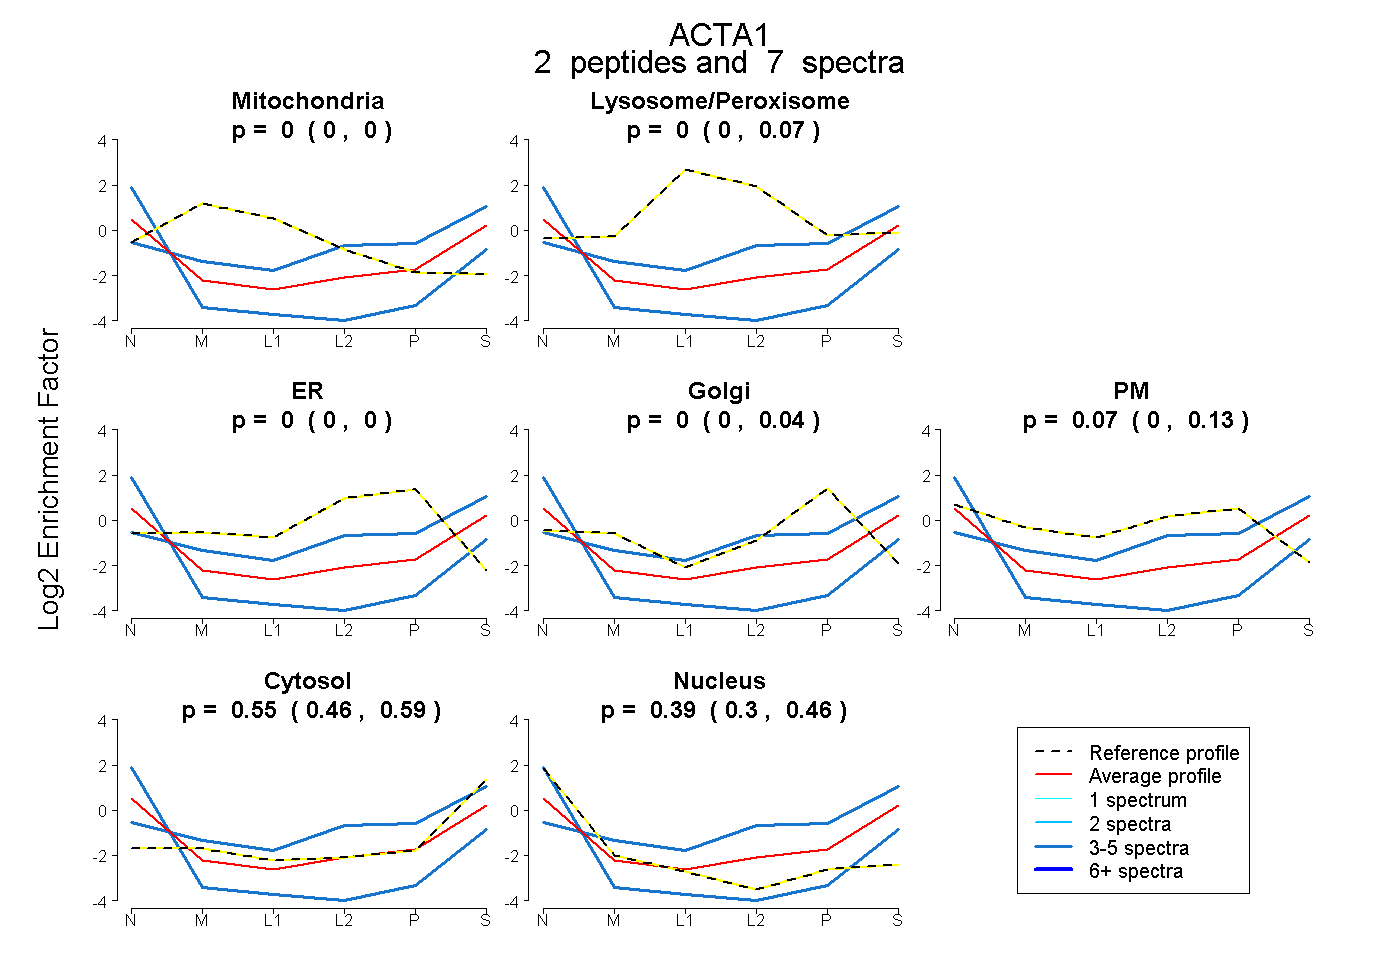
0.000 | 0.000
0.000 | 0.066
0.000 | 0.000
0.000 | 0.040
0.000 | 0.132
0.464 | 0.592
0.304 | 0.461
7peptides
spectra
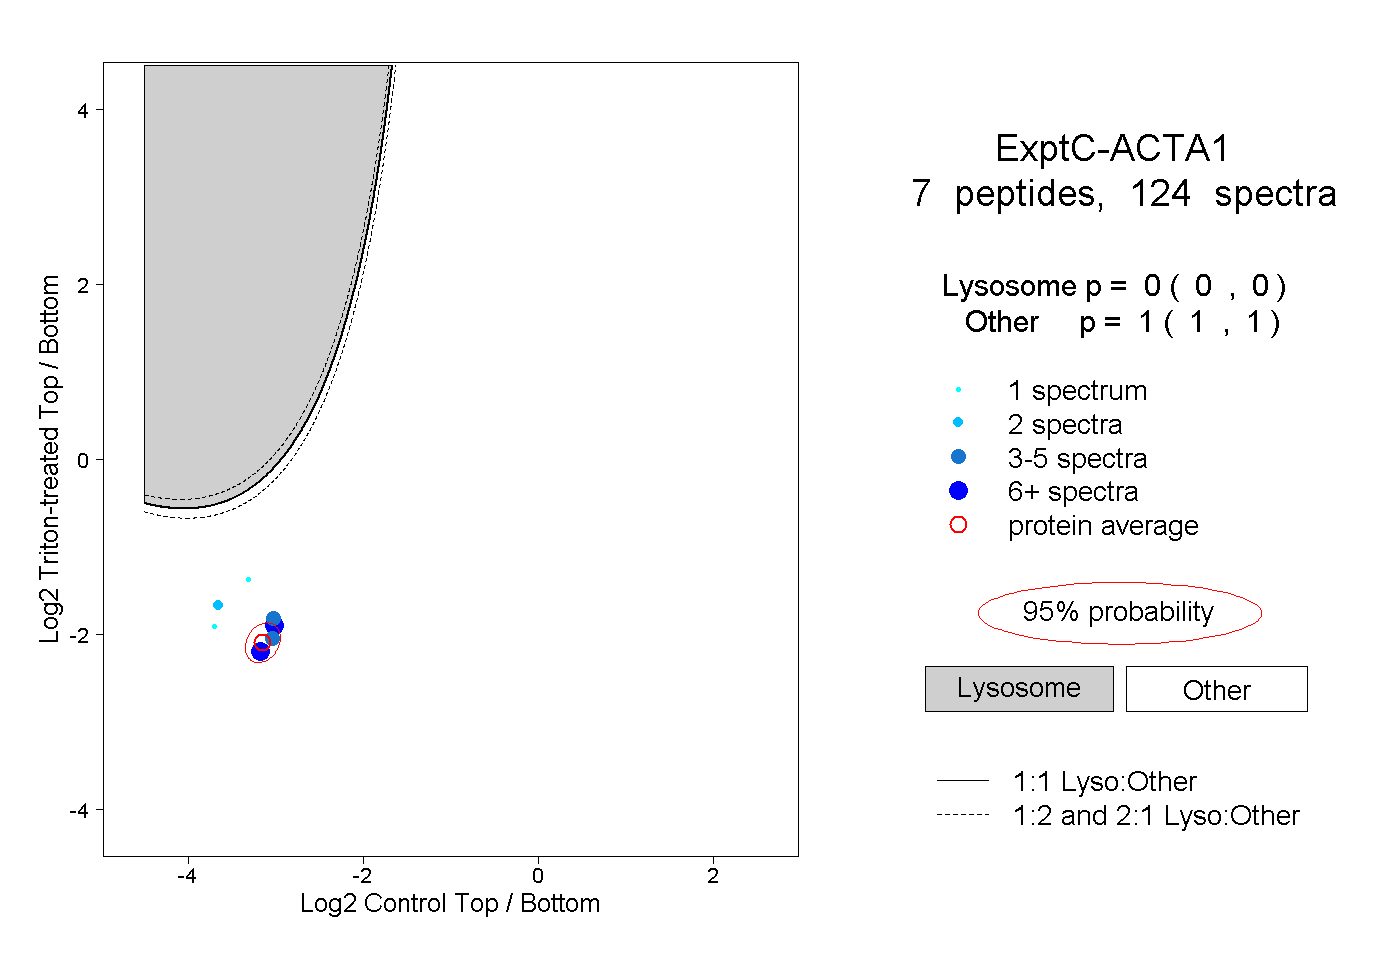
0.000 | 0.000
1.000 | 1.000
5peptides
spectra
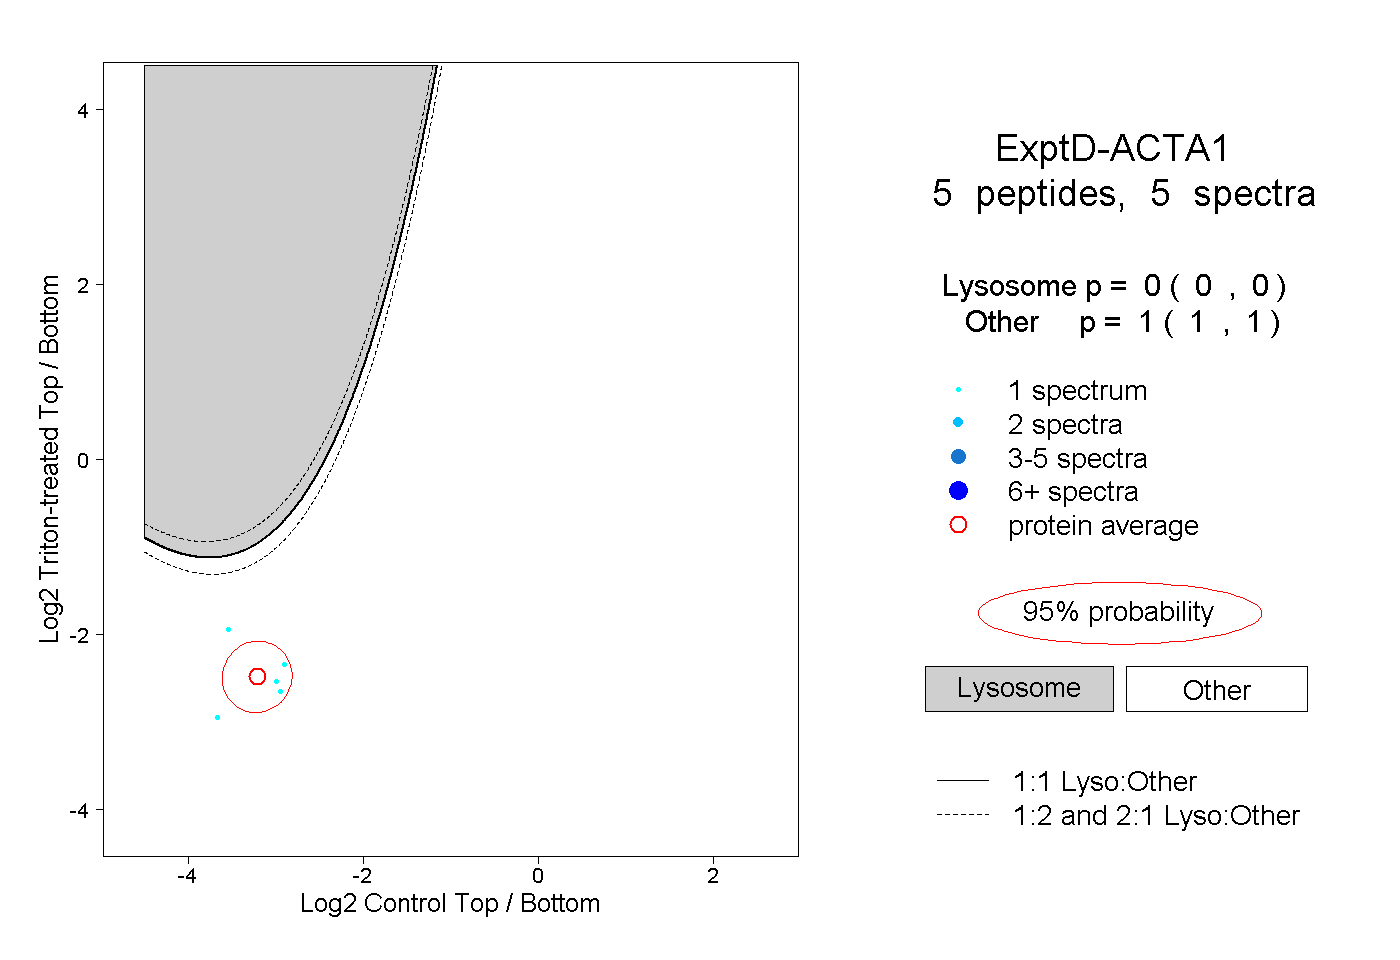
0.000 | 0.000
1.000 | 1.000