13
13peptides
spectra
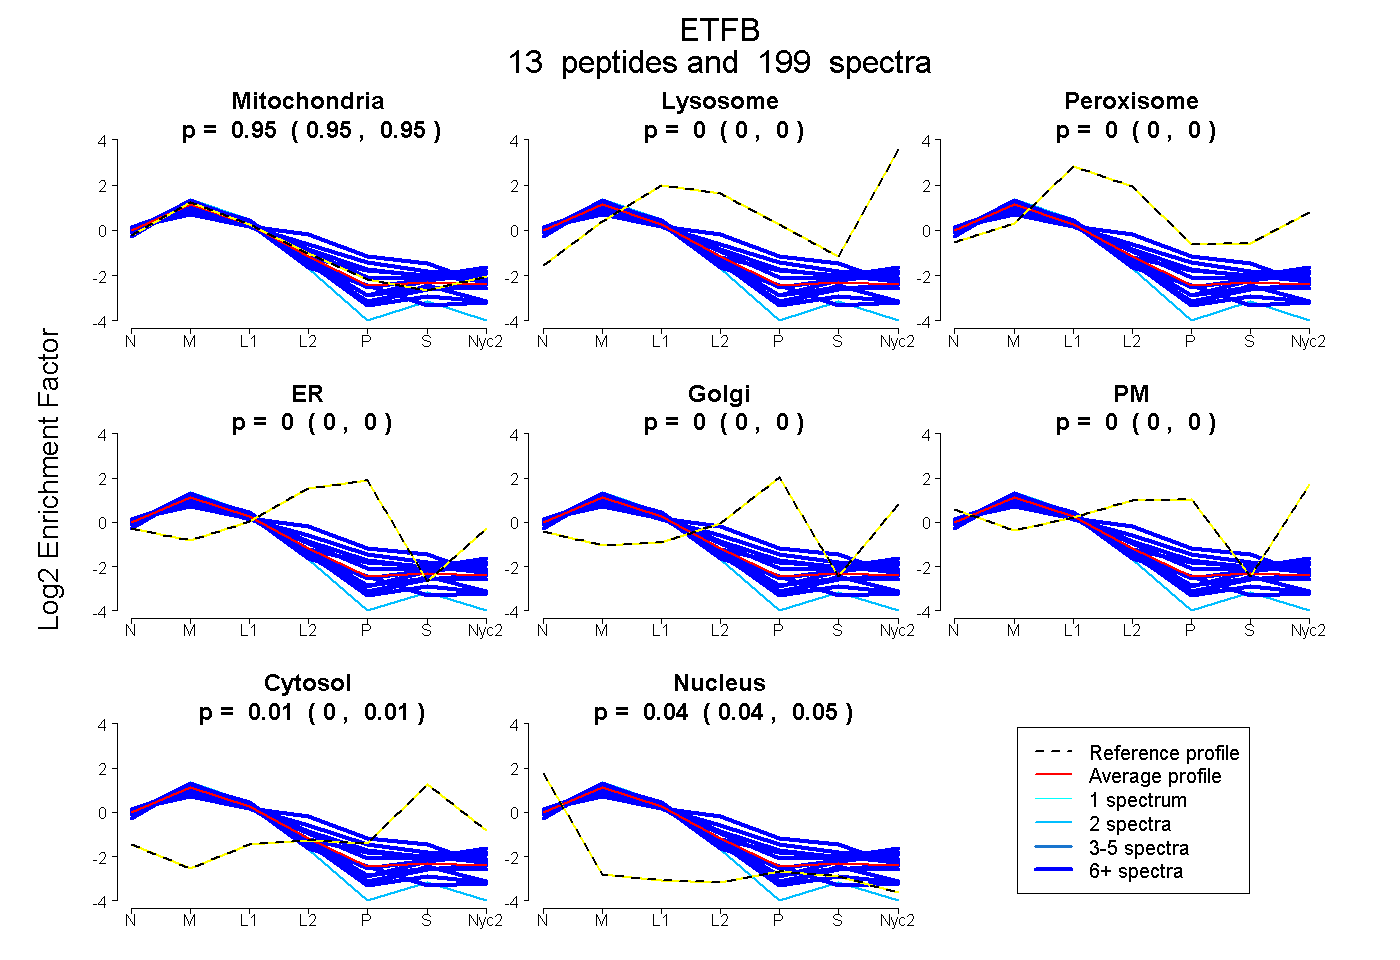
0.946 | 0.950
0.000 | 0.000
0.000 | 0.000
0.000 | 0.000
0.000 | 0.000
0.000 | 0.000
0.004 | 0.010
0.042 | 0.047
12peptides
spectra
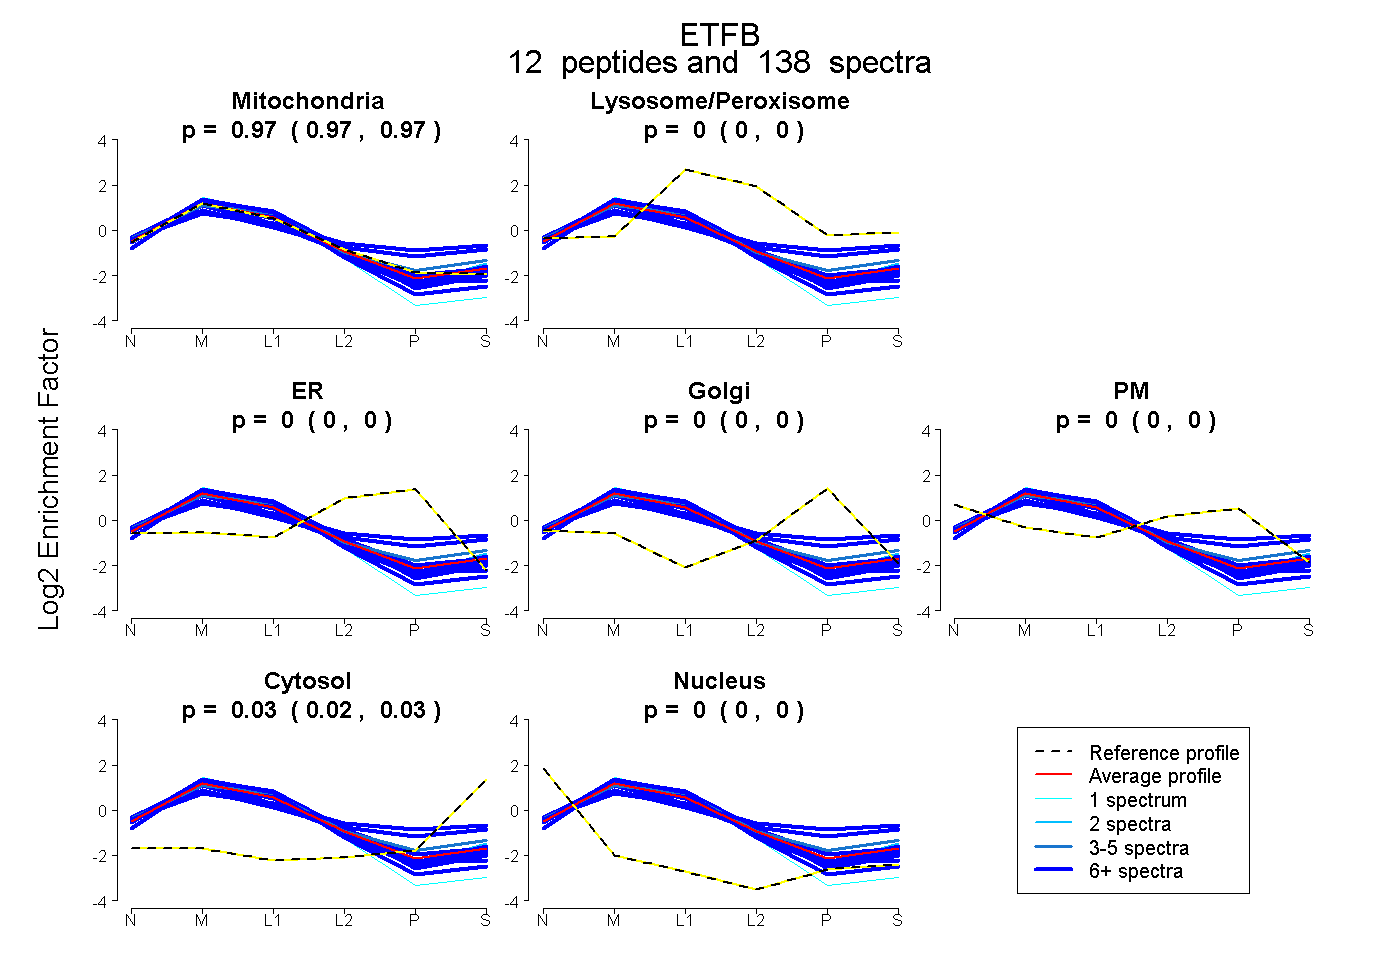
0.967 | 0.974
0.000 | 0.000
0.000 | 0.000
0.000 | 0.000
0.000 | 0.000
0.025 | 0.032
0.000 | 0.001
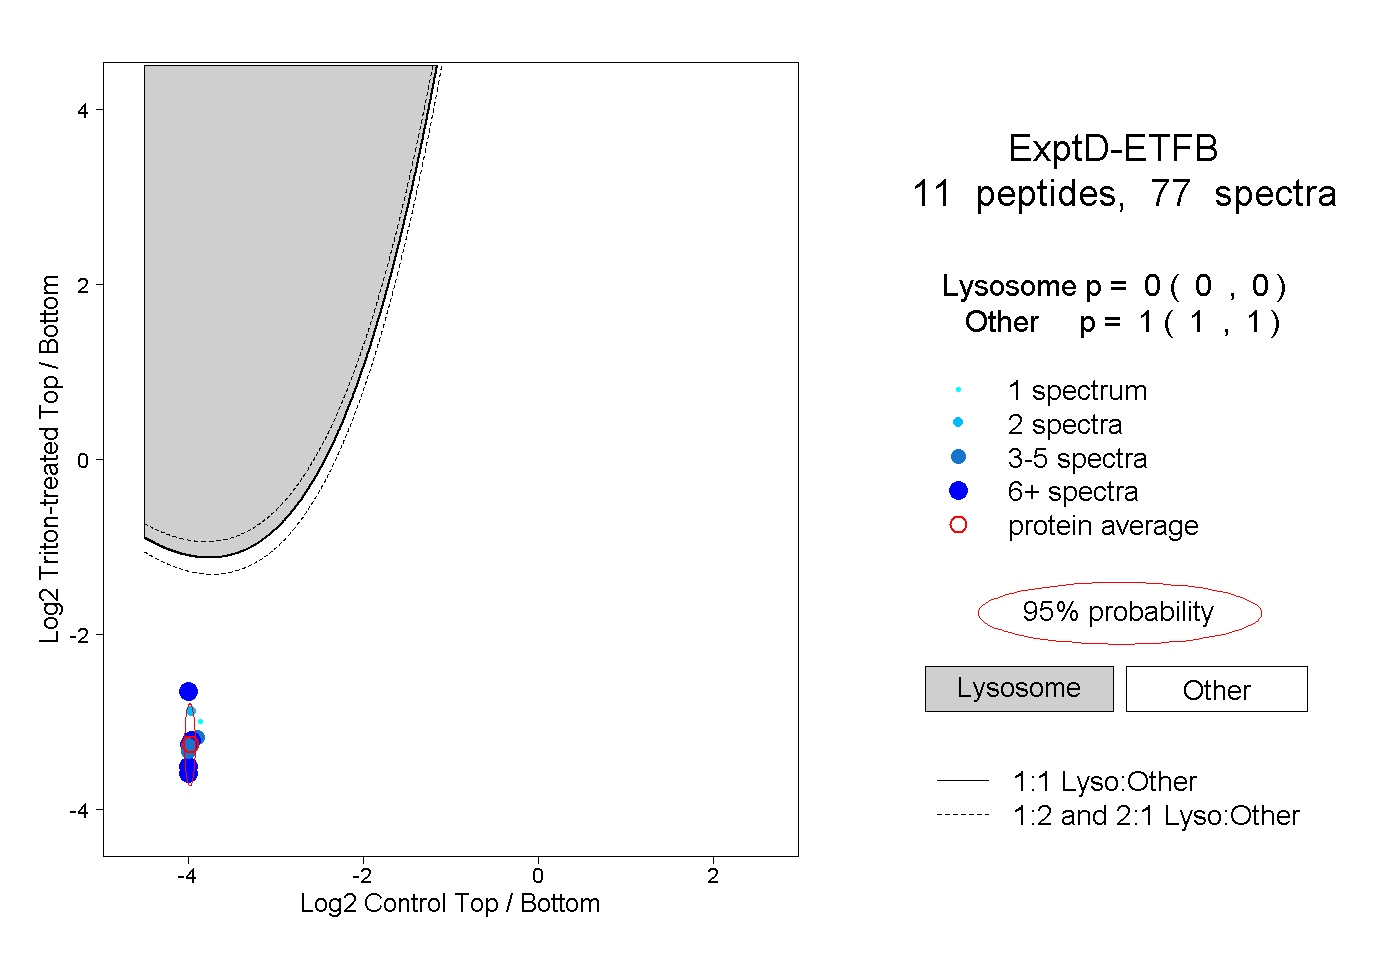
14peptides
spectra
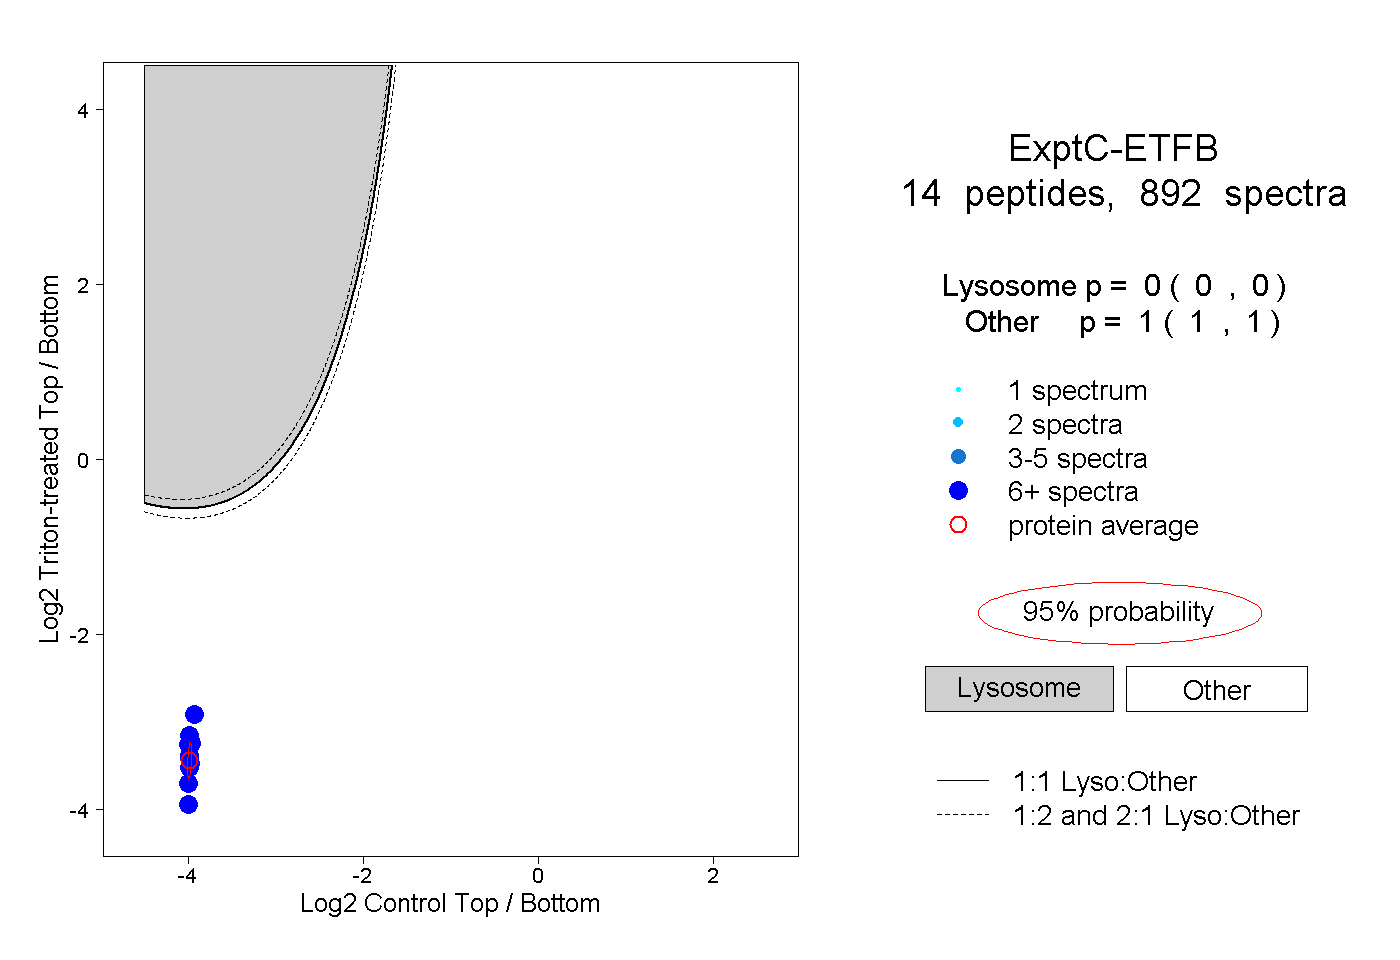
0.000 | 0.000
1.000 | 1.000