 13
13peptides
spectra
0.946 | 0.950
0.000 | 0.000
0.000 | 0.000
0.000 | 0.000
0.000 | 0.000
0.000 | 0.000
0.004 | 0.010
0.042 | 0.047
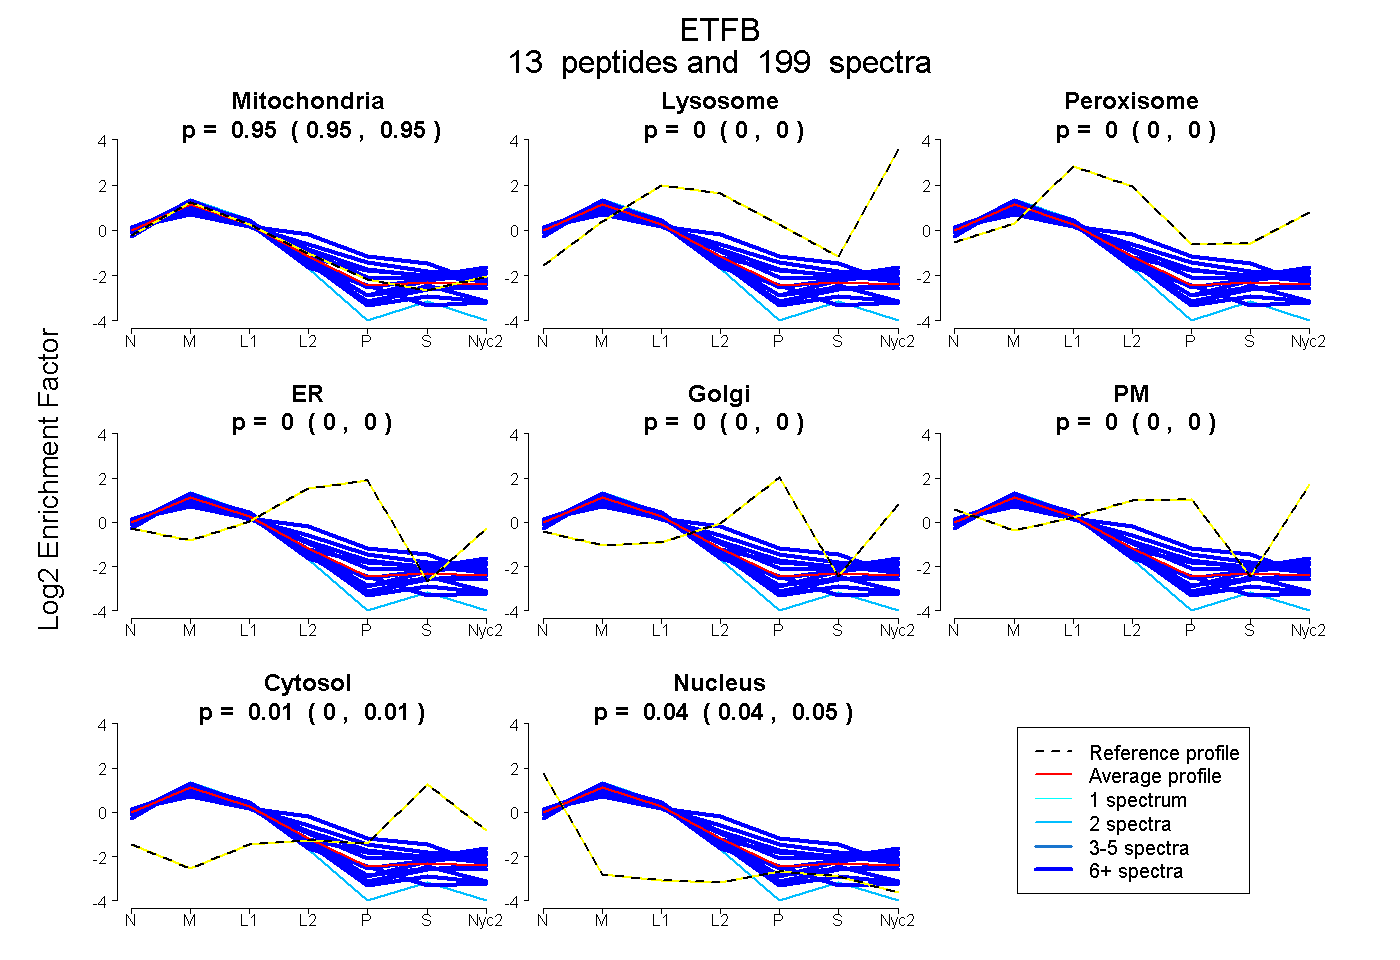
| Plot | Mito | Lyso | Perox | ER | Golgi | PM | Cytosol | Nucleus | |||||
| Expt A |
13 peptides |
199 spectra |
|
0.948 0.946 | 0.950 |
0.000 0.000 | 0.000 |
0.000 0.000 | 0.000 |
0.000 0.000 | 0.000 |
0.000 0.000 | 0.000 |
0.000 0.000 | 0.000 |
0.007 0.004 | 0.010 |
0.045 0.042 | 0.047 |
| 22 spectra, VDLLFLGK | 0.916 | 0.000 | 0.000 | 0.000 | 0.000 | 0.000 | 0.000 | 0.084 | ||
| 6 spectra, VIDFAVK | 0.912 | 0.000 | 0.000 | 0.000 | 0.000 | 0.000 | 0.000 | 0.088 | ||
| 6 spectra, VETTEDLVAK | 0.924 | 0.000 | 0.000 | 0.000 | 0.000 | 0.000 | 0.000 | 0.076 | ||
| 13 spectra, ALVAVK | 0.871 | 0.000 | 0.033 | 0.000 | 0.000 | 0.000 | 0.052 | 0.044 | ||
| 10 spectra, LPAVVTADLR | 0.944 | 0.000 | 0.000 | 0.000 | 0.000 | 0.000 | 0.000 | 0.056 | ||
| 2 spectra, EIIAVSCGPPQCQETIR | 0.879 | 0.000 | 0.000 | 0.000 | 0.000 | 0.000 | 0.000 | 0.121 | ||
| 7 spectra, SGVVTDGVK | 0.965 | 0.000 | 0.000 | 0.000 | 0.000 | 0.000 | 0.017 | 0.019 | ||
| 16 spectra, AGDLGVDLTSK | 0.791 | 0.000 | 0.086 | 0.000 | 0.000 | 0.047 | 0.054 | 0.022 | ||
| 12 spectra, VSVISVEEPPQR | 0.799 | 0.000 | 0.084 | 0.000 | 0.000 | 0.000 | 0.024 | 0.092 | ||
| 30 spectra, TALAMGADR | 0.944 | 0.000 | 0.000 | 0.000 | 0.000 | 0.000 | 0.056 | 0.000 | ||
| 41 spectra, EIDGGLETIR | 0.948 | 0.000 | 0.000 | 0.000 | 0.000 | 0.000 | 0.000 | 0.052 | ||
| 9 spectra, GIHVEVPGAEAENLGPLQVAR | 0.651 | 0.000 | 0.091 | 0.125 | 0.000 | 0.000 | 0.089 | 0.043 | ||
| 25 spectra, HSMNPFCEIAVEEAVR | 0.766 | 0.000 | 0.048 | 0.092 | 0.000 | 0.000 | 0.093 | 0.000 |
| Plot | Mito | Lyso or Perox | ER | Golgi | PM | Cytosol | Nucleus | ||||||
| Expt B |
12 peptides |
138 spectra |
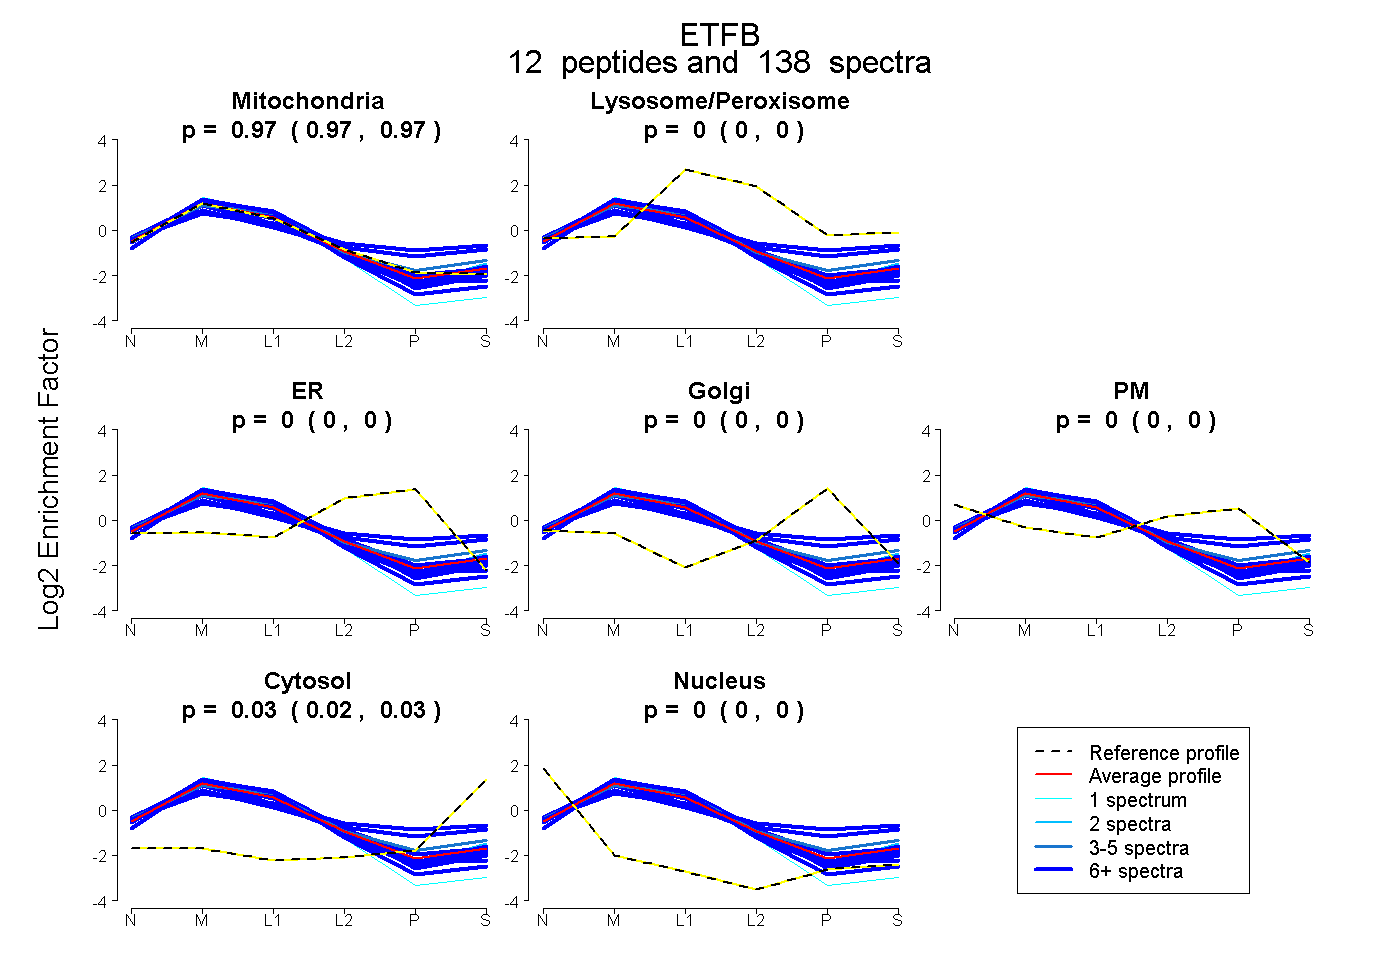 |
0.971 0.967 | 0.974 |
0.000 0.000 | 0.000 |
0.000 0.000 | 0.000 |
0.000 0.000 | 0.000 |
0.000 0.000 | 0.000 |
0.029 0.025 | 0.032 |
0.000 0.000 | 0.001 |
|||
| Plot | Lyso | Other | |||||||||||
| Expt C |
14 peptides |
892 spectra |
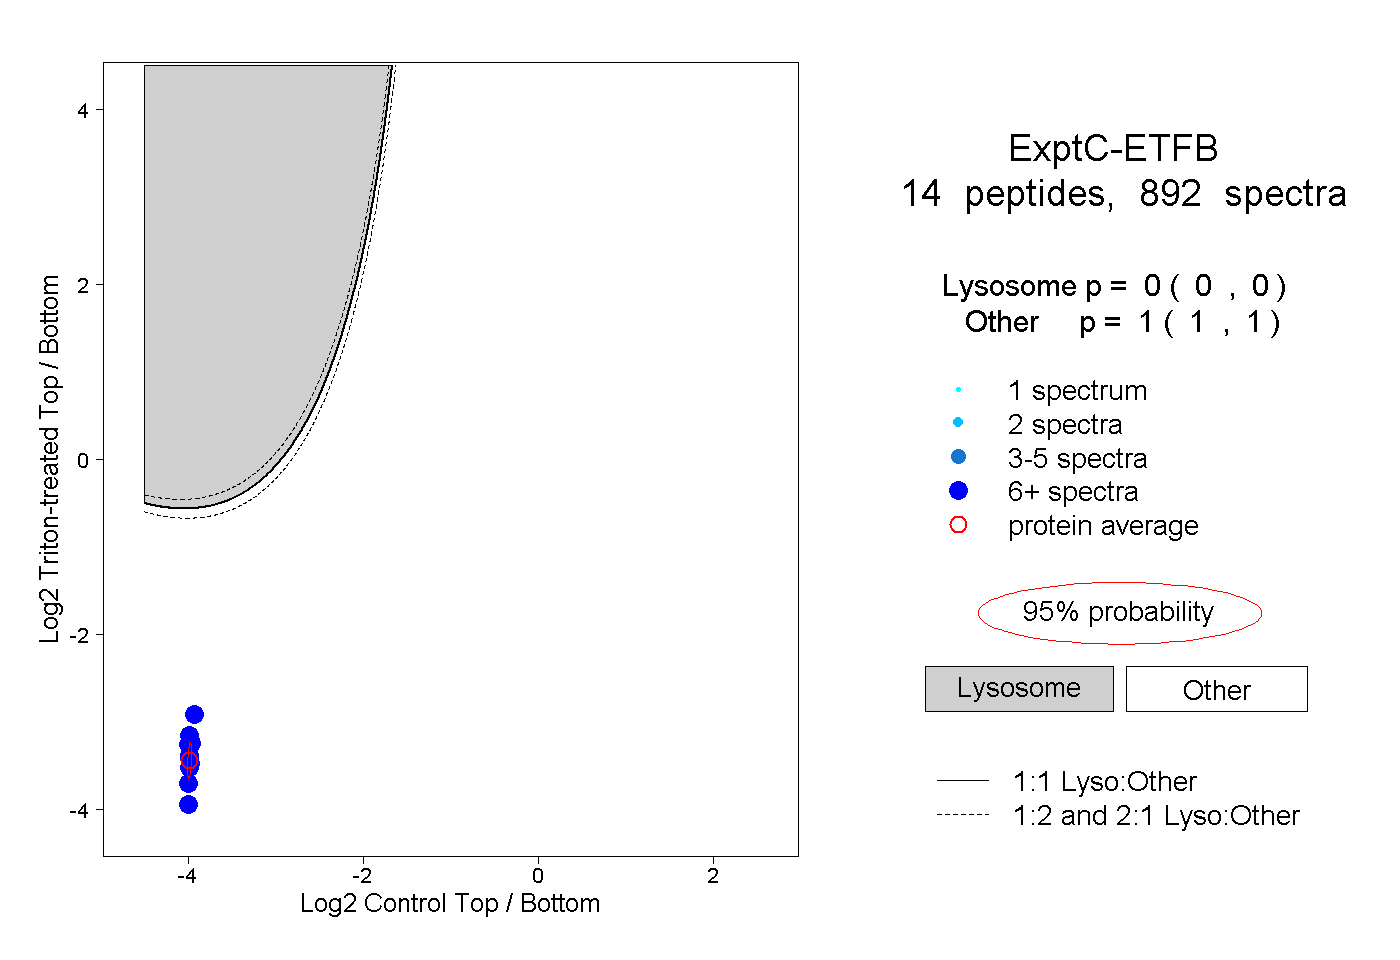 |
0.000 0.000 | 0.000 |
1.000 1.000 | 1.000 |
||||||||
| Plot | Lyso | Other | |||||||||||
| Expt D |
11 peptides |
77 spectra |
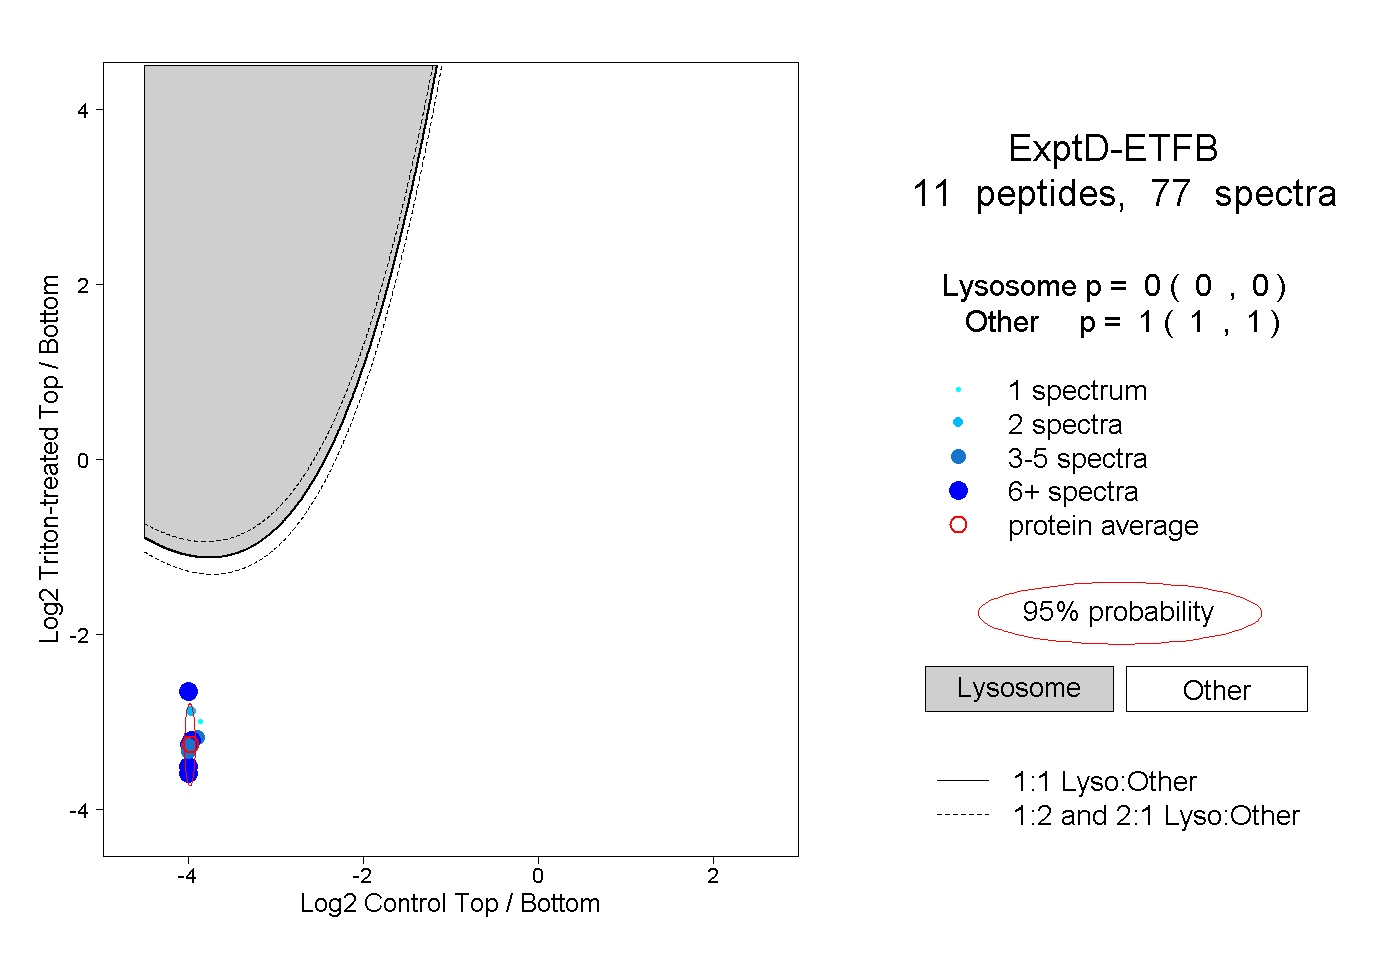 |
0.000 0.000 | 0.000 |
1.000 1.000 | 1.000 |