 4
4peptides
spectra
0.238 | 0.467
0.000 | 0.000
0.000 | 0.239
0.000 | 0.404
0.000 | 0.366
0.000 | 0.000
0.033 | 0.265
0.000 | 0.000
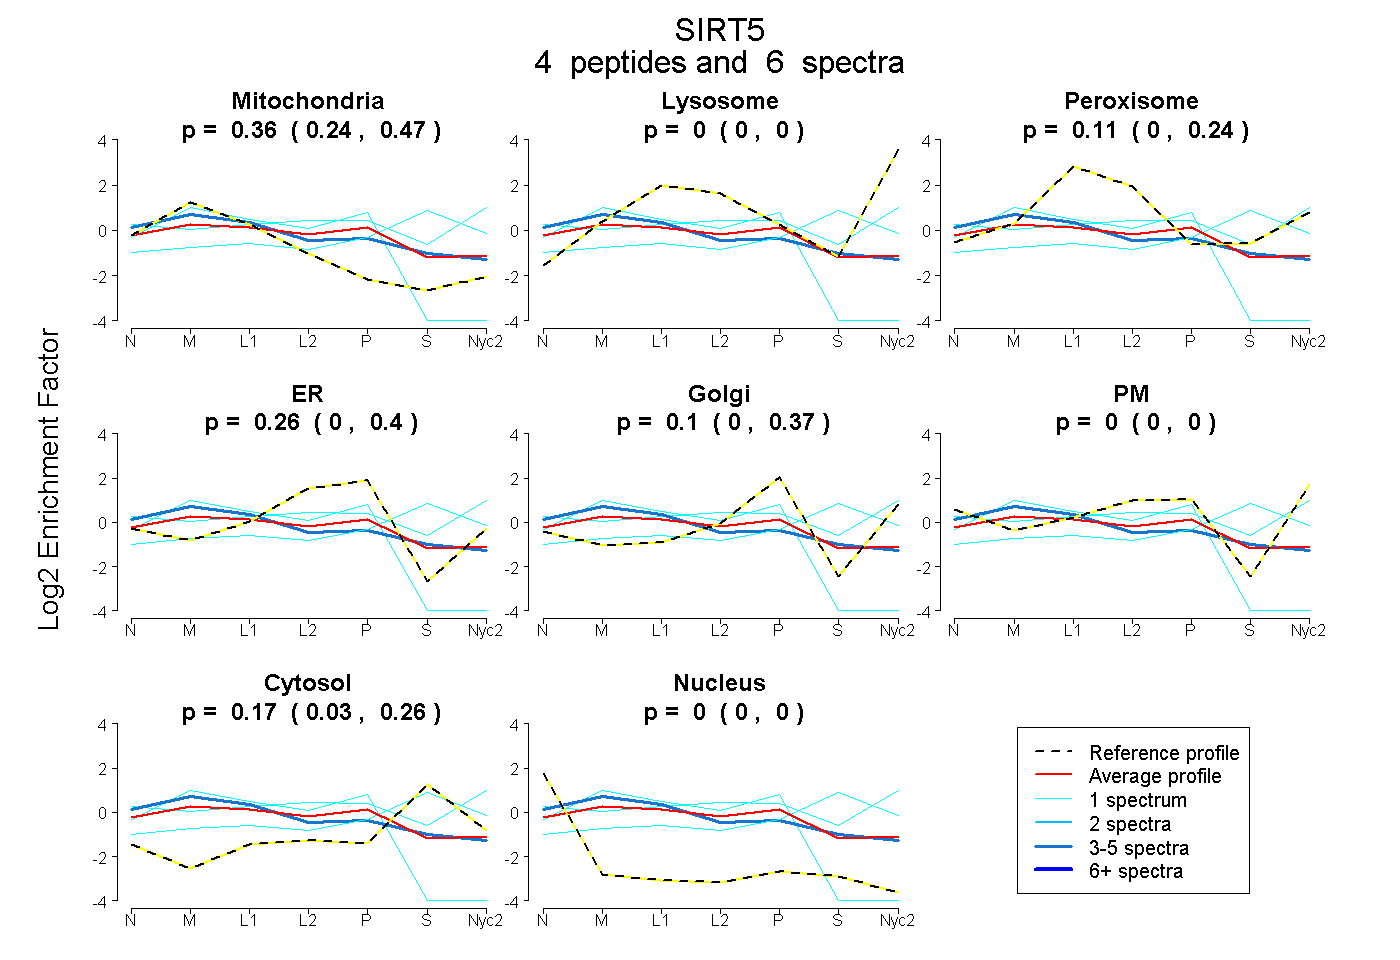
| Plot | Mito | Lyso | Perox | ER | Golgi | PM | Cytosol | Nucleus | |||||
| Expt A |
4 peptides |
6 spectra |
|
0.364 0.238 | 0.467 |
0.000 0.000 | 0.000 |
0.112 0.000 | 0.239 |
0.257 0.000 | 0.404 |
0.100 0.000 | 0.366 |
0.000 0.000 | 0.000 |
0.167 0.033 | 0.265 |
0.000 0.000 | 0.000 |
| 3 spectra, GAPEPDTQESR | 0.489 | 0.000 | 0.179 | 0.081 | 0.118 | 0.000 | 0.134 | 0.000 | ||
| 1 spectrum, FHFPGPCGVTLPEALAPHETER | 0.601 | 0.000 | 0.000 | 0.393 | 0.000 | 0.000 | 0.000 | 0.006 | ||
| 1 spectrum, VVVITQNIDELHR | 0.061 | 0.113 | 0.096 | 0.000 | 0.104 | 0.000 | 0.626 | 0.000 | ||
| 1 spectrum, CFANAK | 0.010 | 0.001 | 0.223 | 0.000 | 0.000 | 0.552 | 0.214 | 0.000 |
| Plot | Mito | Lyso or Perox | ER | Golgi | PM | Cytosol | Nucleus | ||||||
| Expt B |
1 peptide |
1 spectrum |
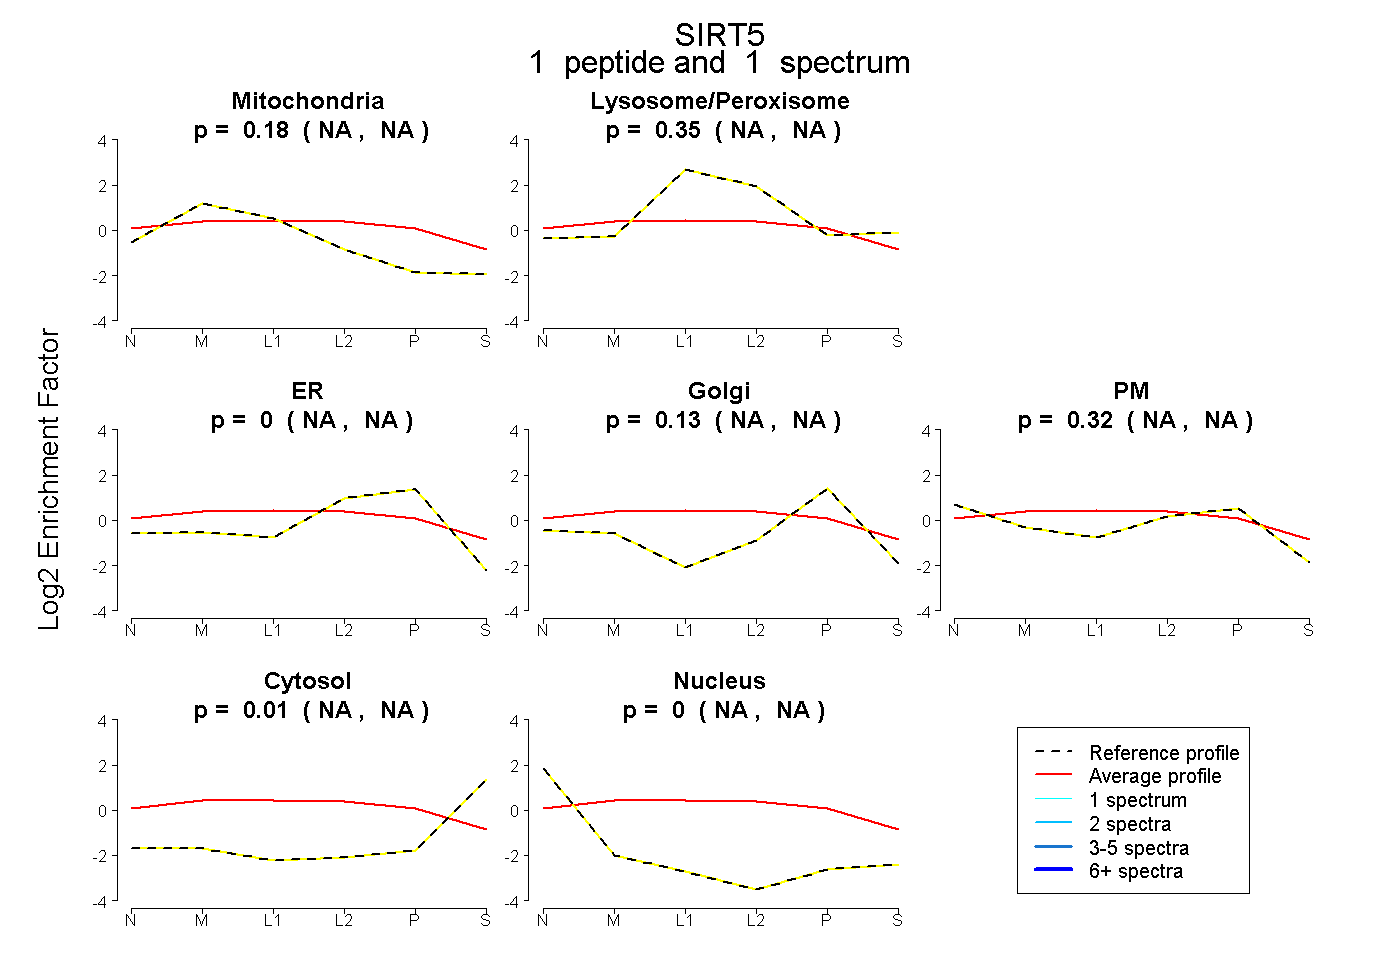 |
0.184 NA | NA |
0.355 NA | NA |
0.000 NA | NA |
0.129 NA | NA |
0.321 NA | NA |
0.012 NA | NA |
0.000 NA | NA |
|||
| Plot | Lyso | Other | |||||||||||
| Expt C |
6 peptides |
13 spectra |
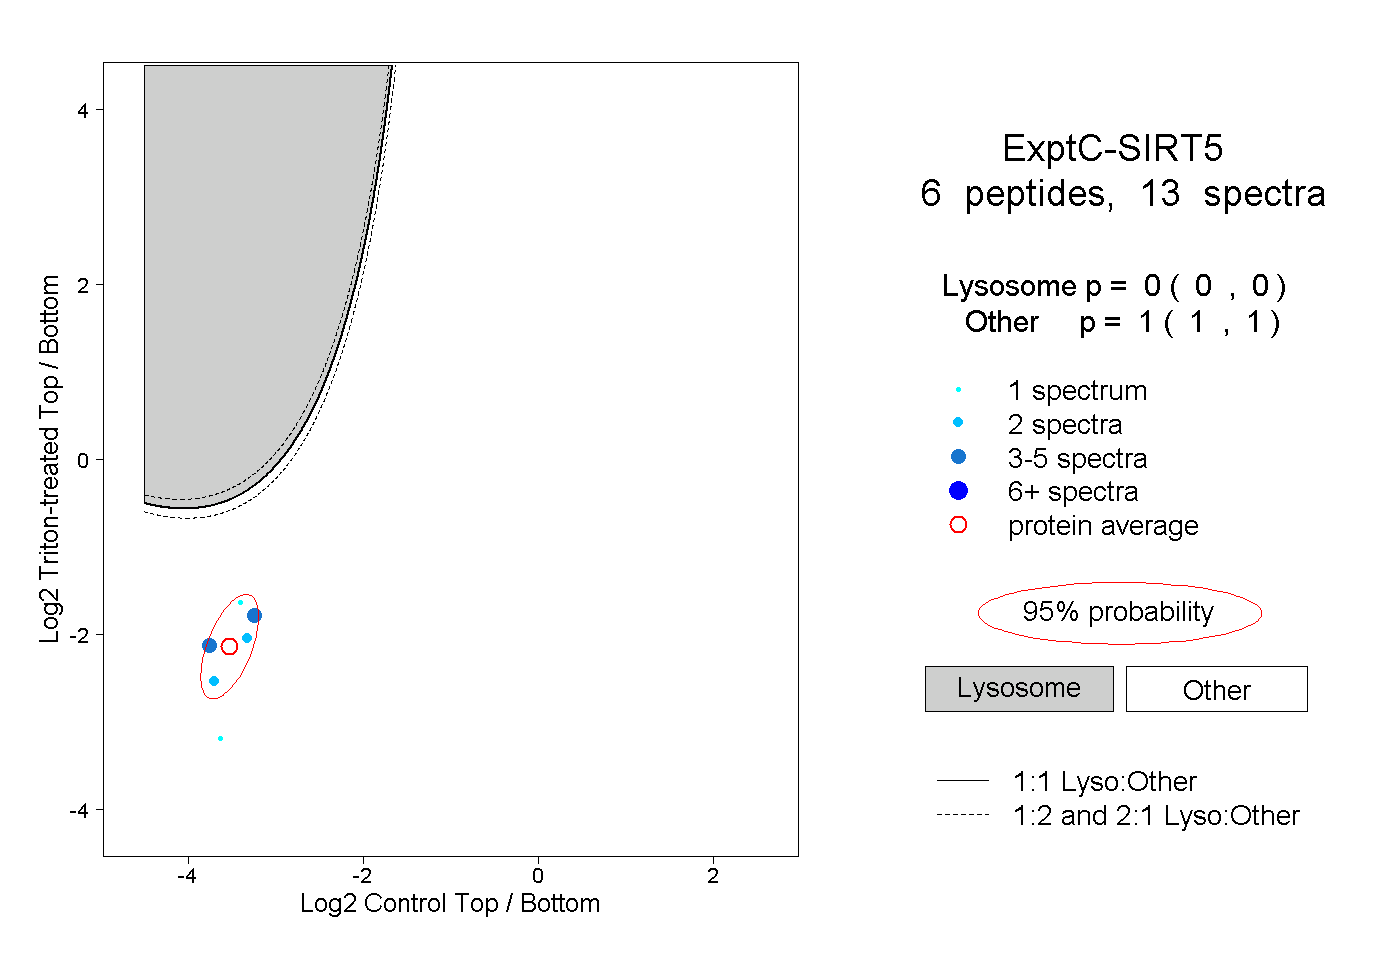 |
0.000 0.000 | 0.000 |
1.000 1.000 | 1.000 |
||||||||
| Plot | Lyso | Other | |||||||||||
| Expt D |
1 peptide |
3 spectra |
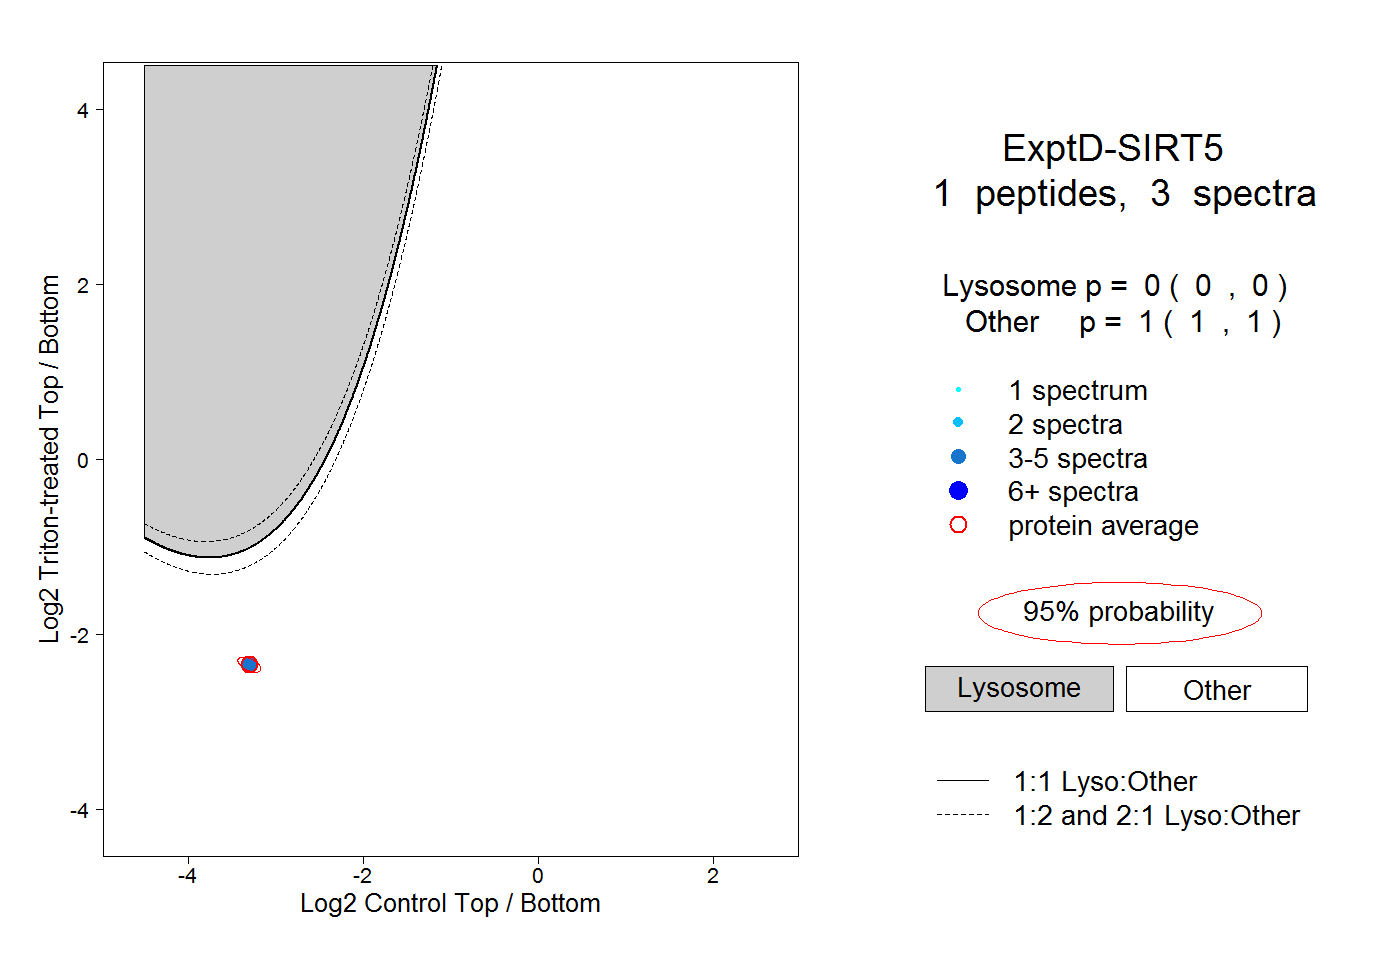 |
0.000 0.000 | 0.000 |
1.000 1.000 | 1.000 |