 3
3peptides
spectra
0.000 | 0.058
0.000 | 0.090
0.000 | 0.056
0.000 | 0.000
0.000 | 0.012
0.670 | 0.869
0.000 | 0.165
0.030 | 0.192
1peptide
spectrum

NA | NA
NA | NA
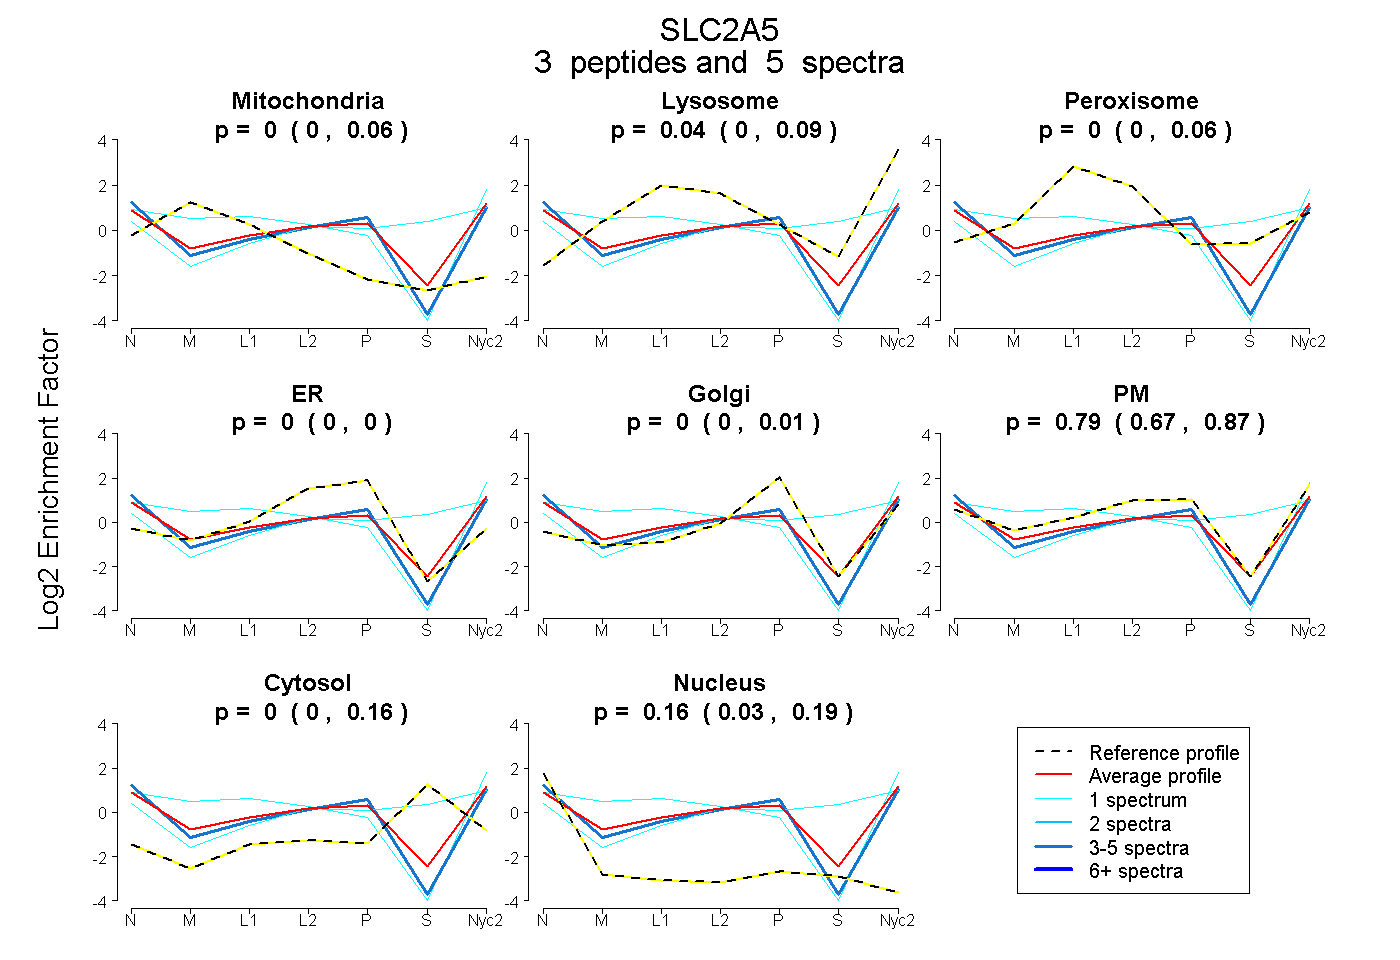
| Plot | Mito | Lyso | Perox | ER | Golgi | PM | Cytosol | Nucleus | |||||
| Expt A |
3 peptides |
5 spectra |
|
0.000 0.000 | 0.058 |
0.044 0.000 | 0.090 |
0.000 0.000 | 0.056 |
0.000 0.000 | 0.000 |
0.000 0.000 | 0.012 |
0.793 0.670 | 0.869 |
0.000 0.000 | 0.165 |
0.163 0.030 | 0.192 |
||
| Plot | Lyso | Other | |||||||||||
| Expt D |
1 peptide |
1 spectrum |
|
0.000 NA | NA |
1.000 NA | NA |