 4
4peptides
spectra
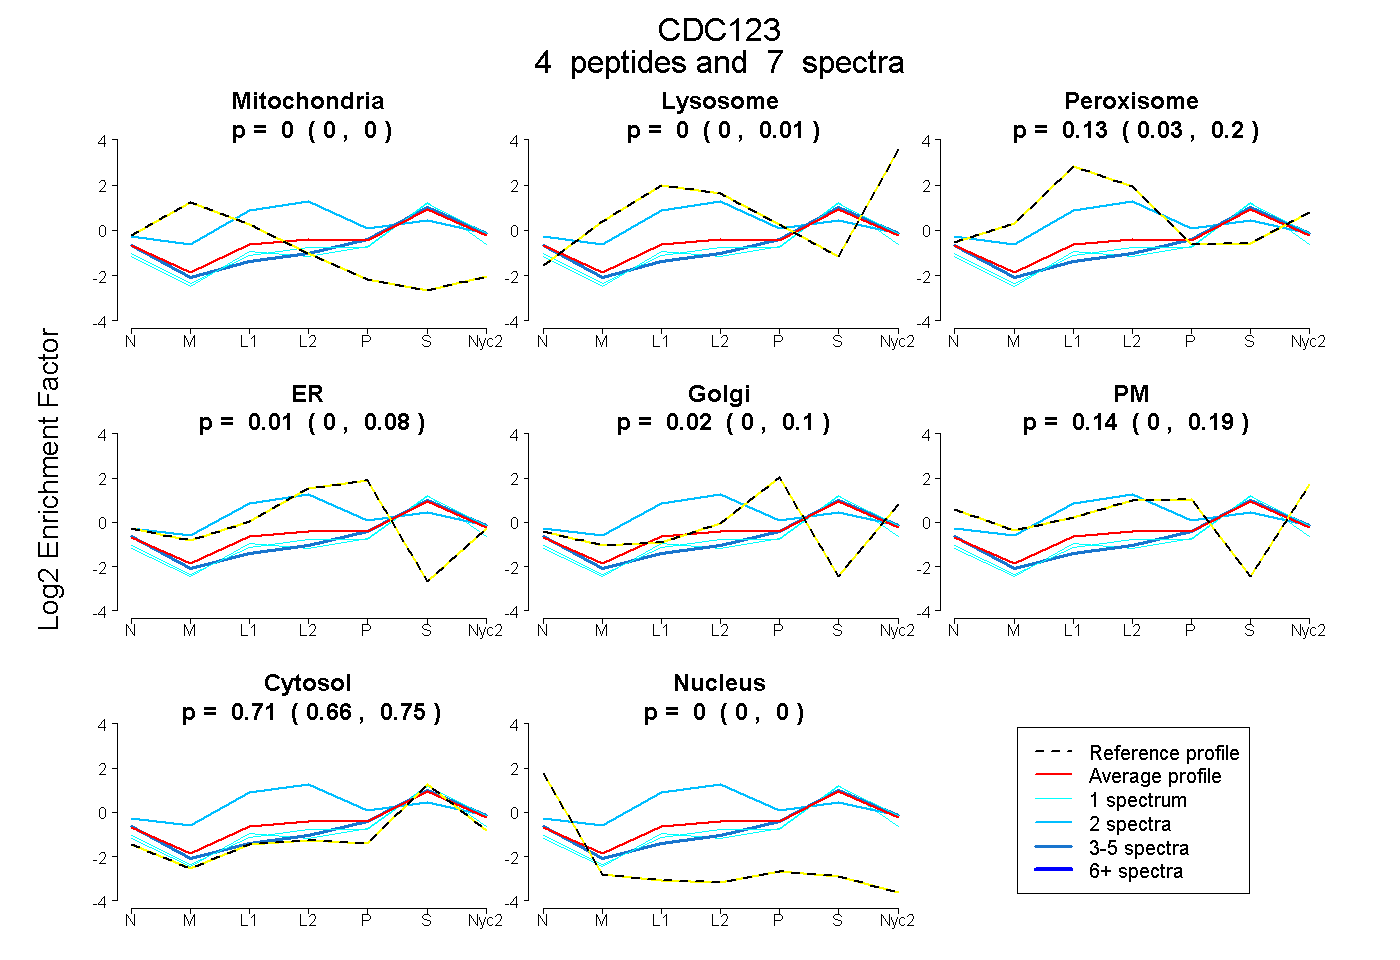
0.000 | 0.000
0.000 | 0.013
0.033 | 0.202
0.000 | 0.079
0.000 | 0.102
0.004 | 0.192
0.658 | 0.749
0.000 | 0.000
1peptide
spectra
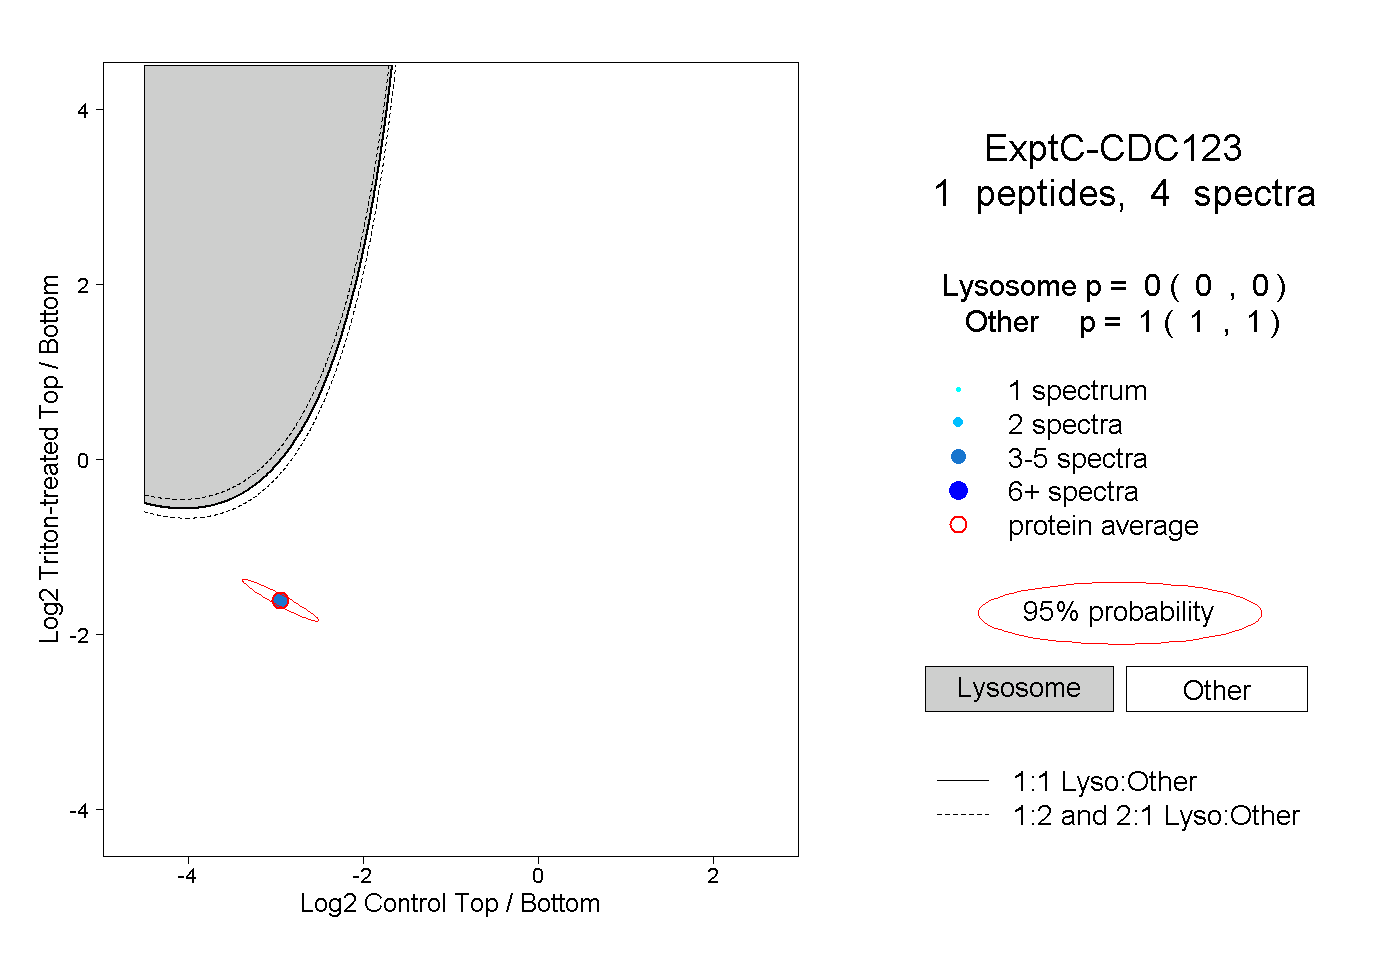
0.000 | 0.000
1.000 | 1.000
| Plot | Mito | Lyso | Perox | ER | Golgi | PM | Cytosol | Nucleus | |||||
| Expt A |
4 peptides |
7 spectra |
|
0.000 0.000 | 0.000 |
0.000 0.000 | 0.013 |
0.125 0.033 | 0.202 |
0.006 0.000 | 0.079 |
0.018 0.000 | 0.102 |
0.142 0.004 | 0.192 |
0.709 0.658 | 0.749 |
0.000 0.000 | 0.000 |
||
| Plot | Lyso | Other | |||||||||||
| Expt C |
1 peptide |
4 spectra |
|
0.000 0.000 | 0.000 |
1.000 1.000 | 1.000 |