 21
21peptides
spectra
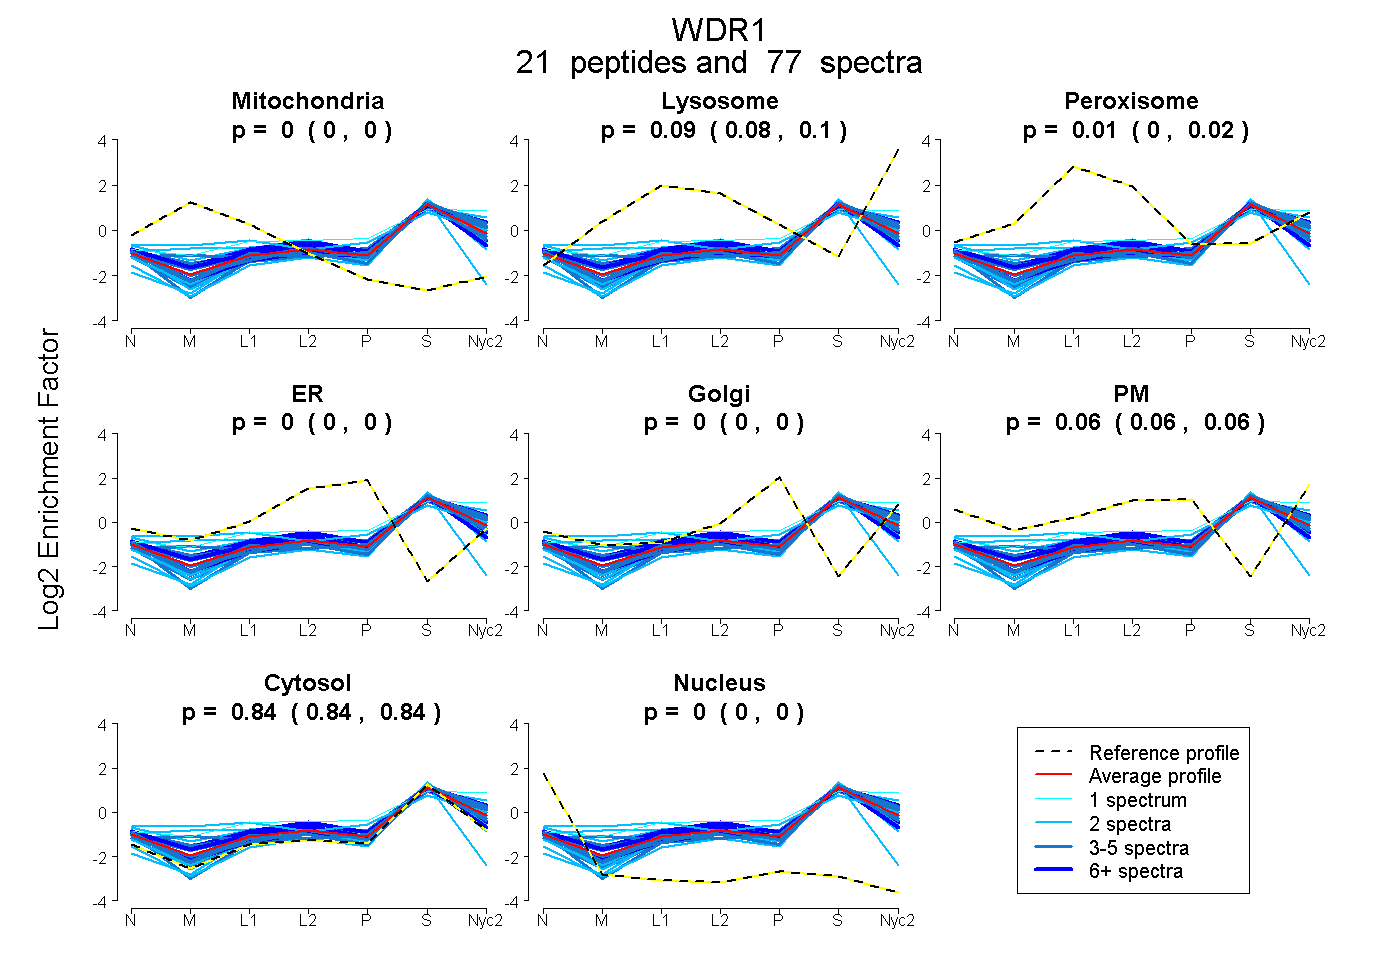
0.000 | 0.000
0.077 | 0.095
0.004 | 0.019
0.000 | 0.000
0.000 | 0.000
0.055 | 0.061
0.840 | 0.844
0.000 | 0.000
11peptides
spectra
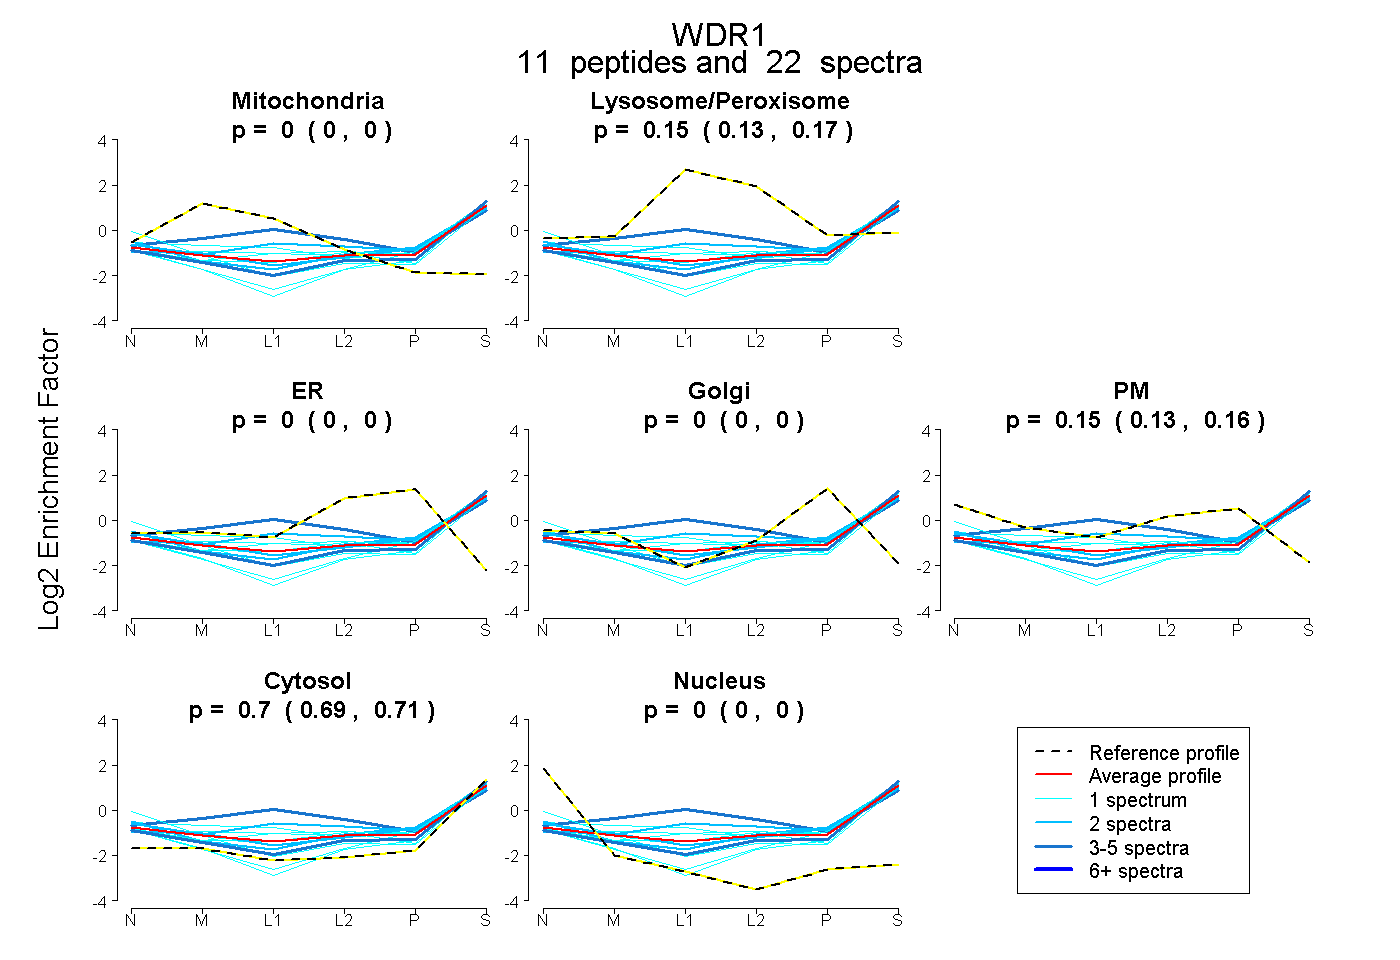
0.000 | 0.000
0.128 | 0.169
0.000 | 0.000
0.000 | 0.000
0.129 | 0.160
0.694 | 0.711
0.000 | 0.000
22peptides
spectra
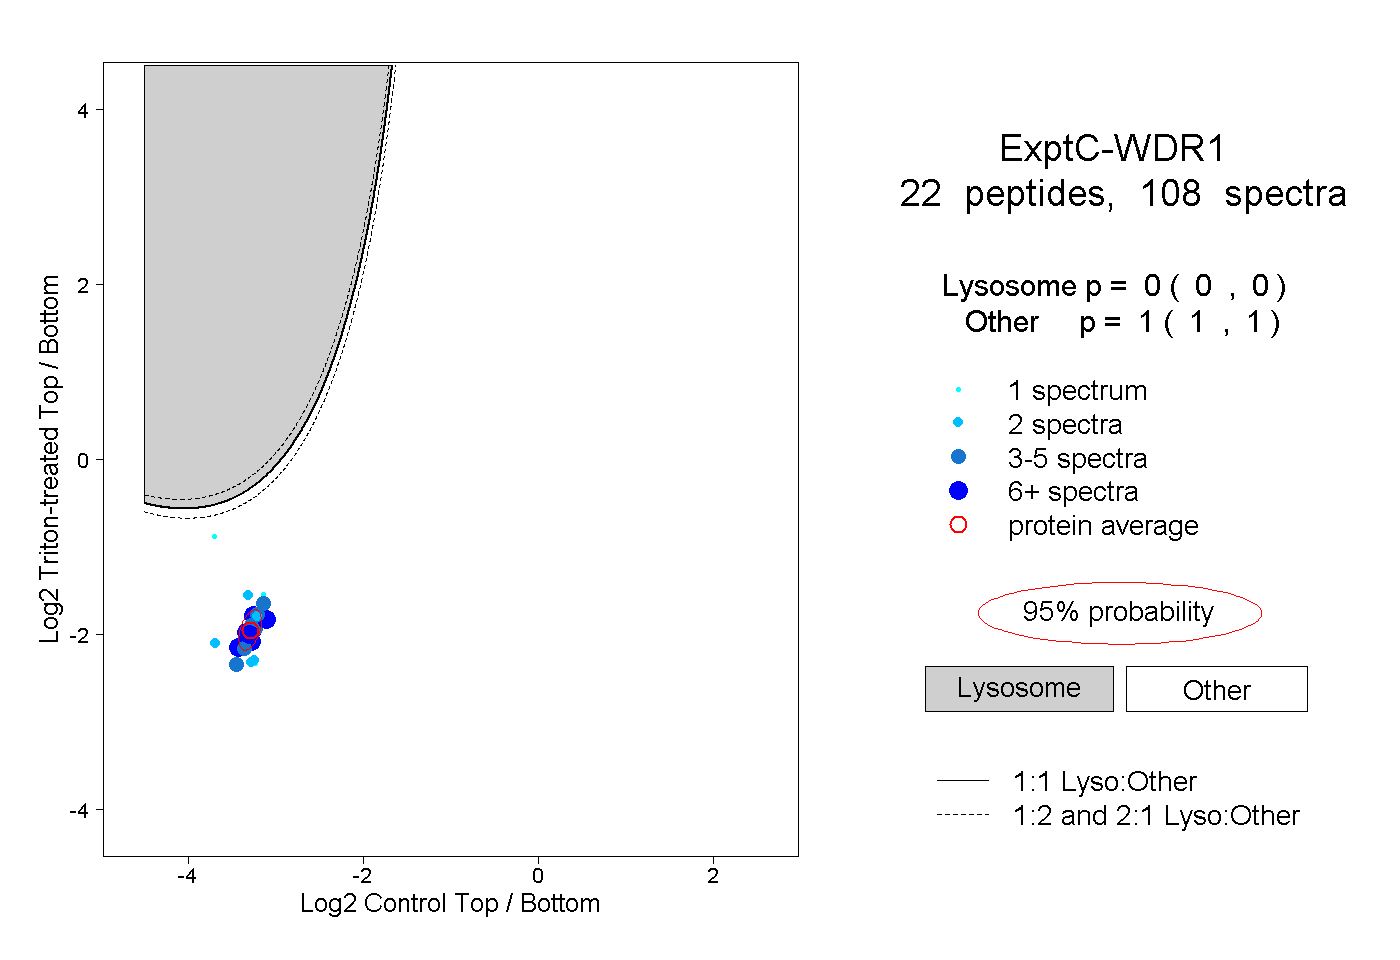
0.000 | 0.000
1.000 | 1.000
6peptides
spectra
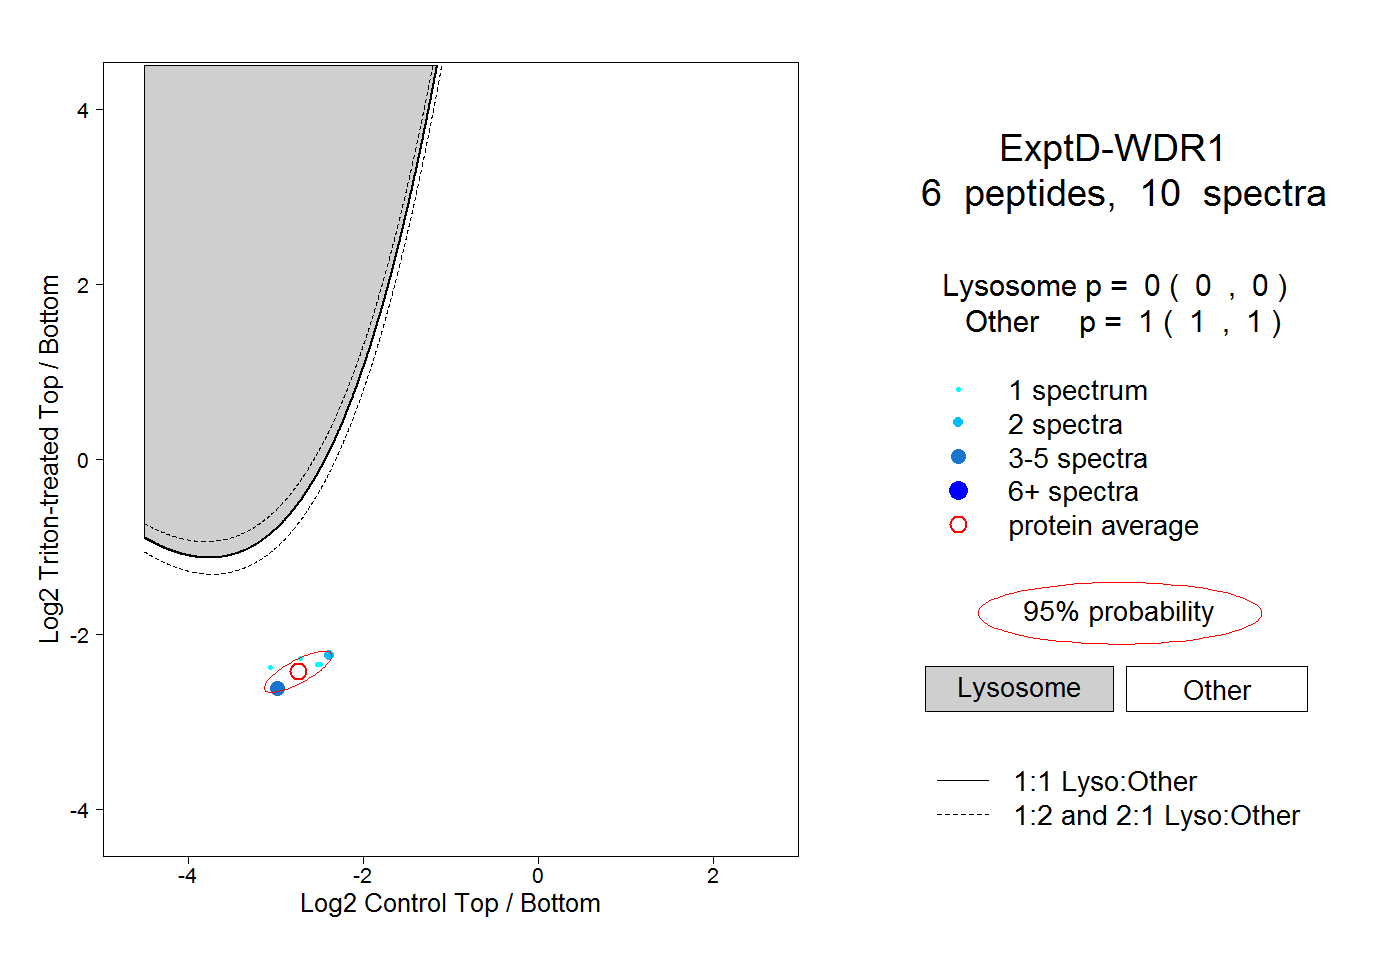
0.000 | 0.000
1.000 | 1.000