18
18peptides
spectra
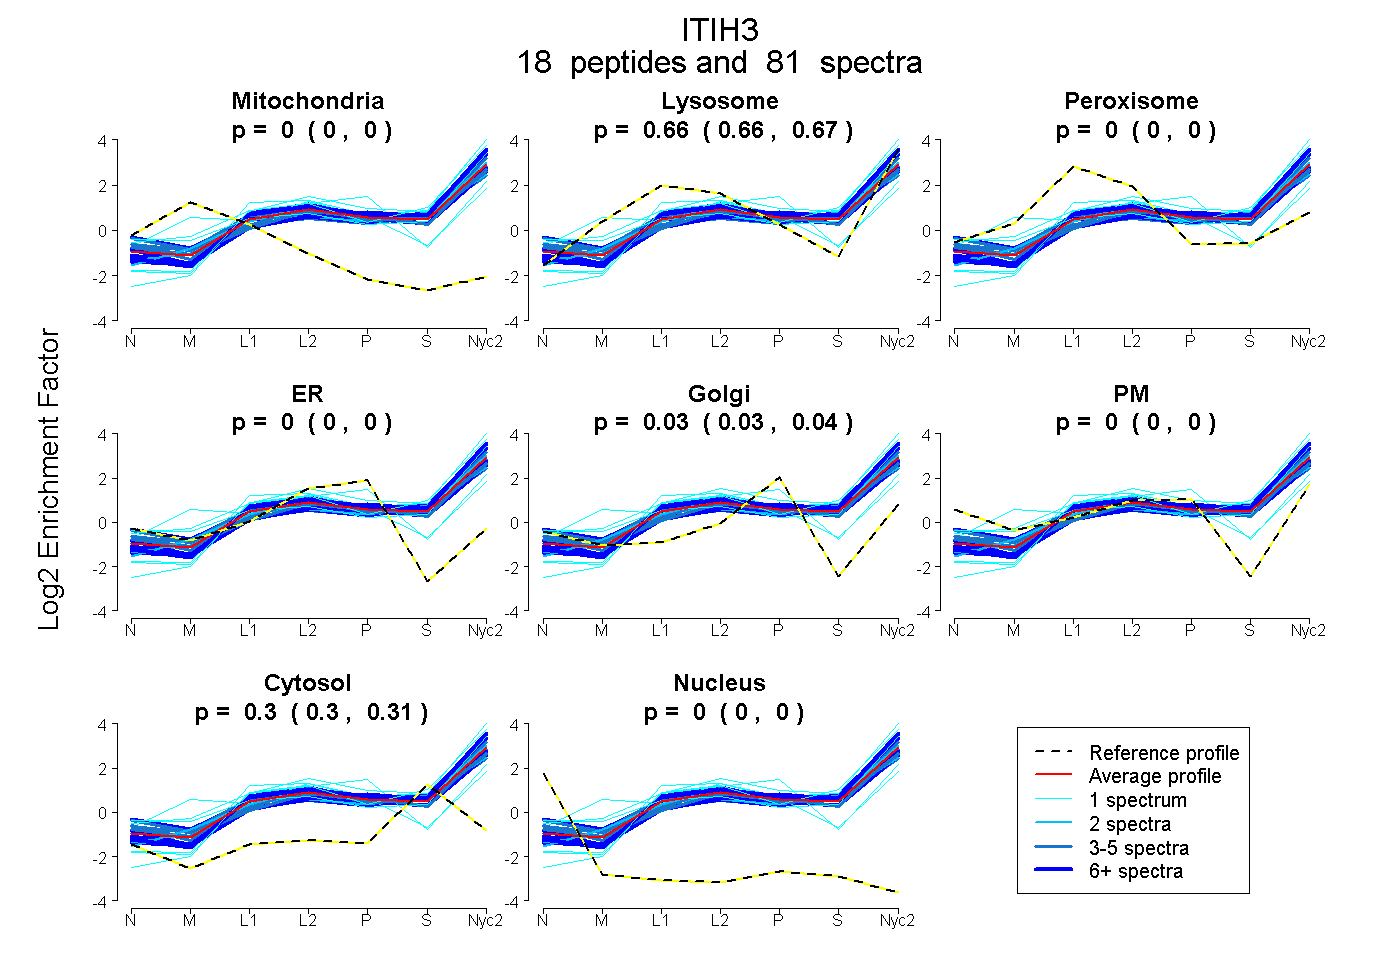
0.000 | 0.000
0.661 | 0.668
0.000 | 0.000
0.000 | 0.000
0.028 | 0.036
0.000 | 0.000
0.299 | 0.305
0.000 | 0.000
11peptides
spectra
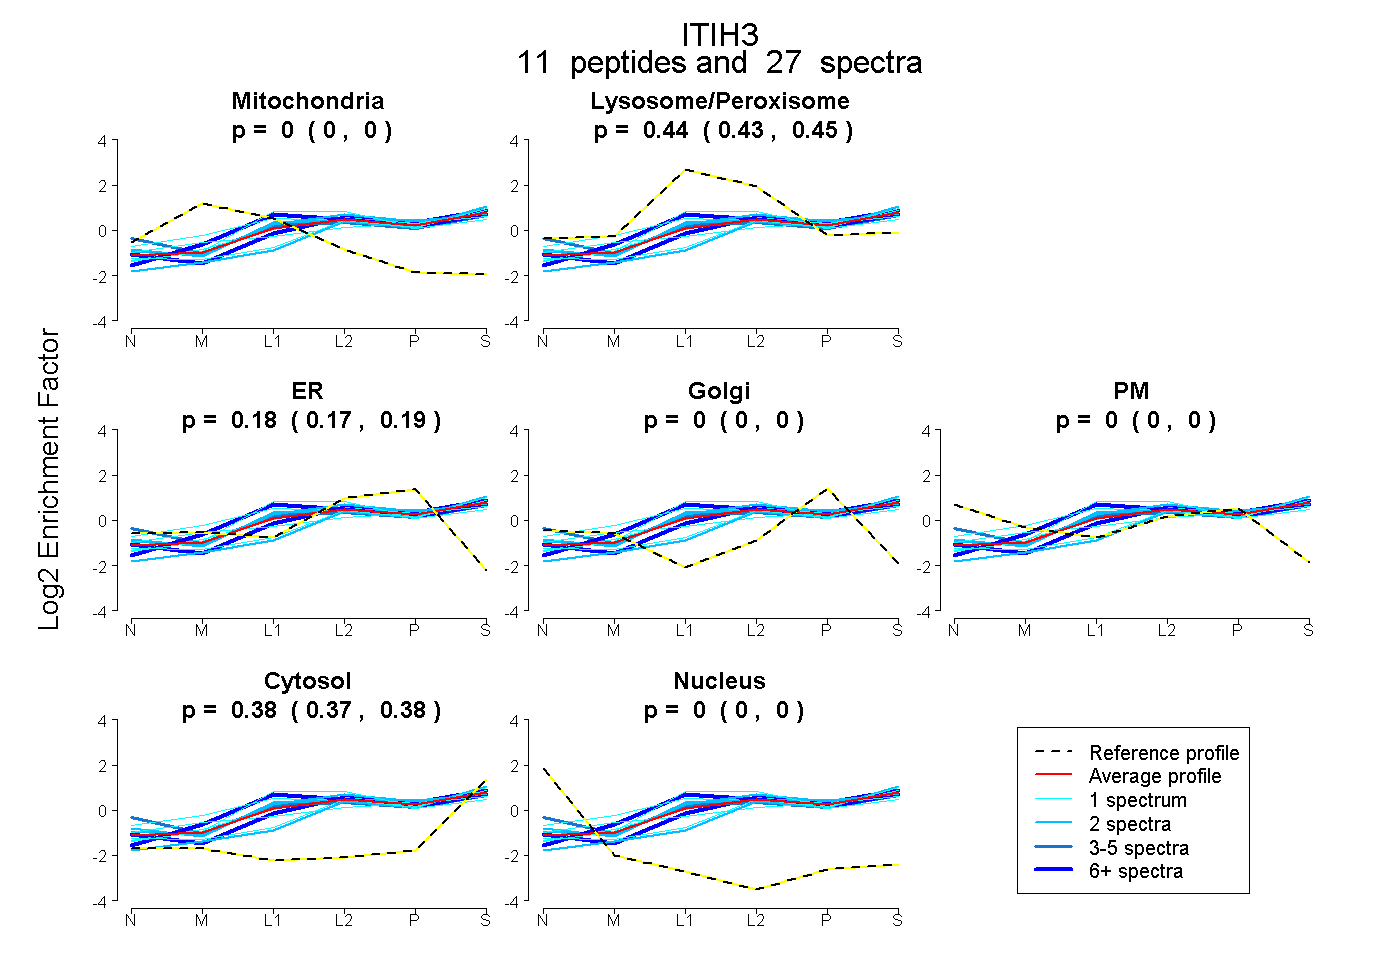
0.000 | 0.000
0.429 | 0.450
0.174 | 0.189
0.000 | 0.000
0.000 | 0.000
0.373 | 0.382
0.000 | 0.000