 17
17peptides
spectra
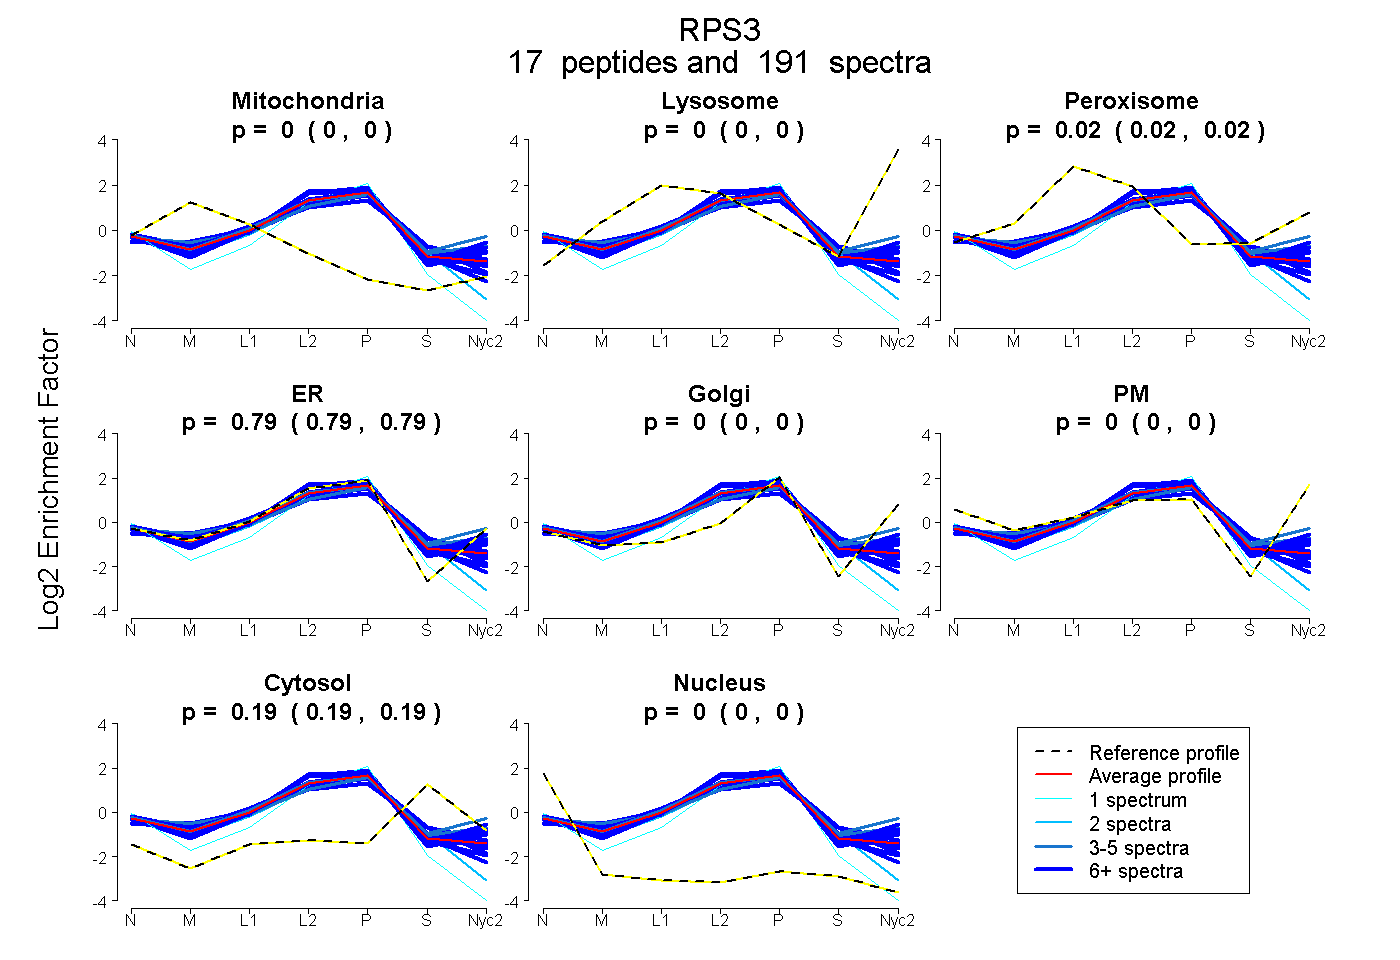
0.000 | 0.000
0.000 | 0.000
0.019 | 0.022
0.786 | 0.790
0.000 | 0.000
0.000 | 0.000
0.190 | 0.192
0.000 | 0.000
15peptides
spectra
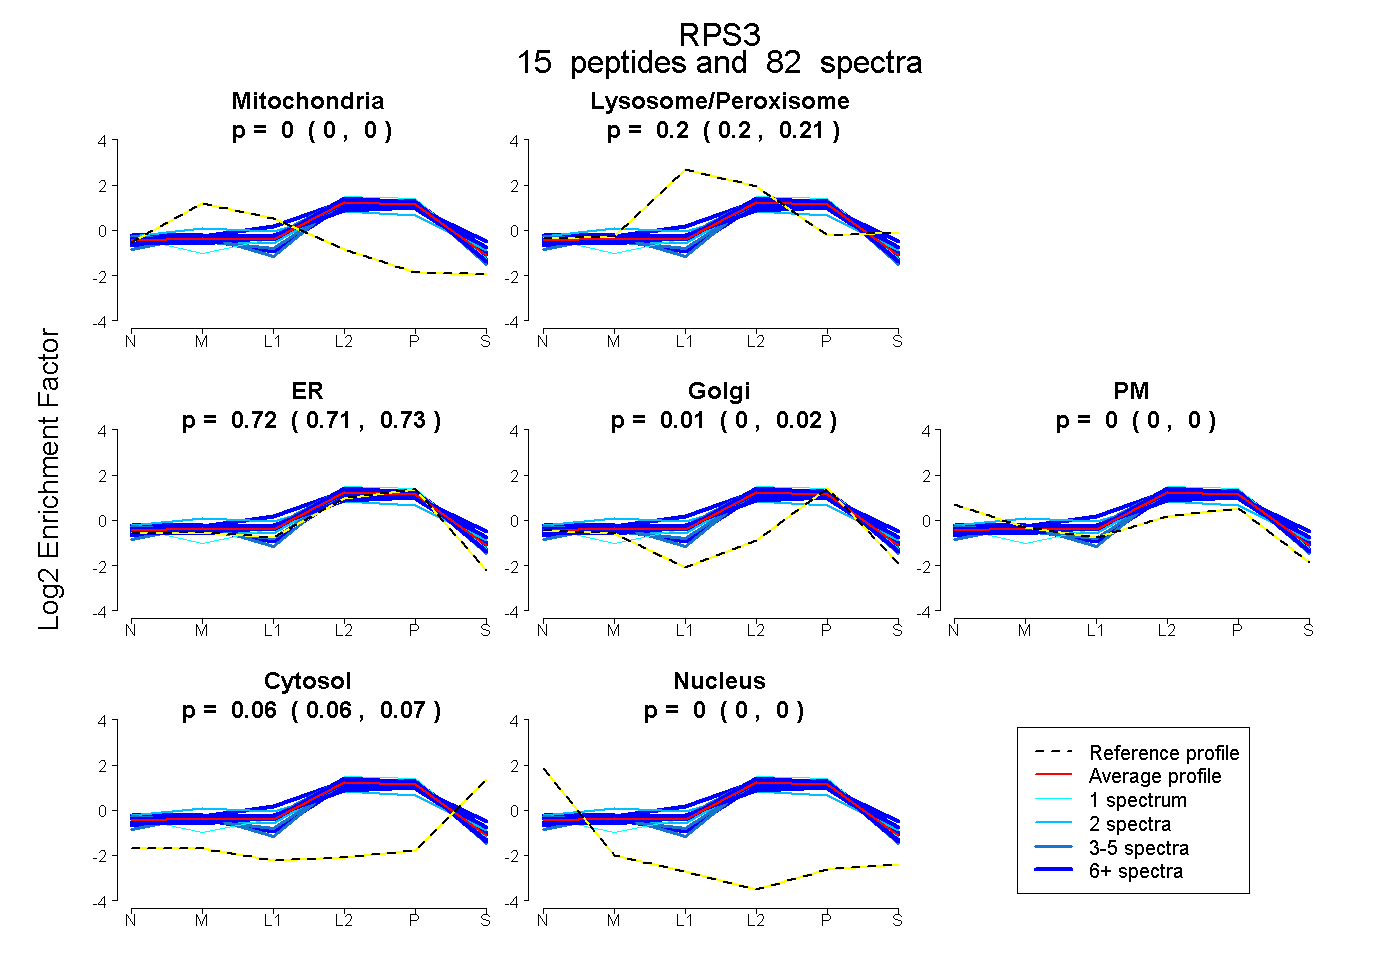
0.000 | 0.000
0.197 | 0.208
0.707 | 0.732
0.003 | 0.023
0.000 | 0.000
0.059 | 0.065
0.000 | 0.000
18peptides
spectra
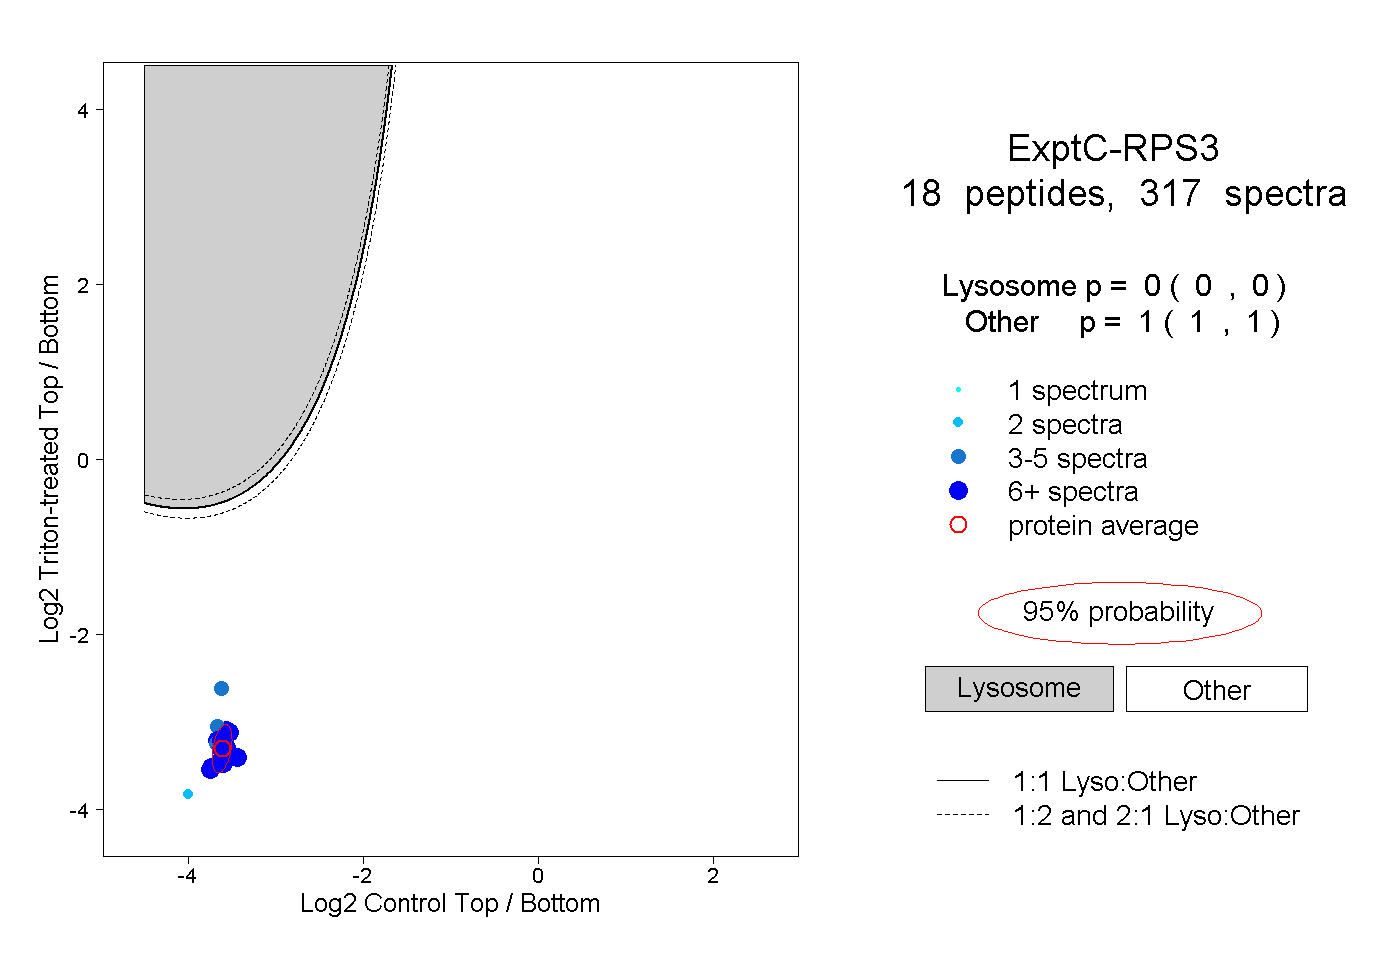
0.000 | 0.000
1.000 | 1.000
12peptides
spectra
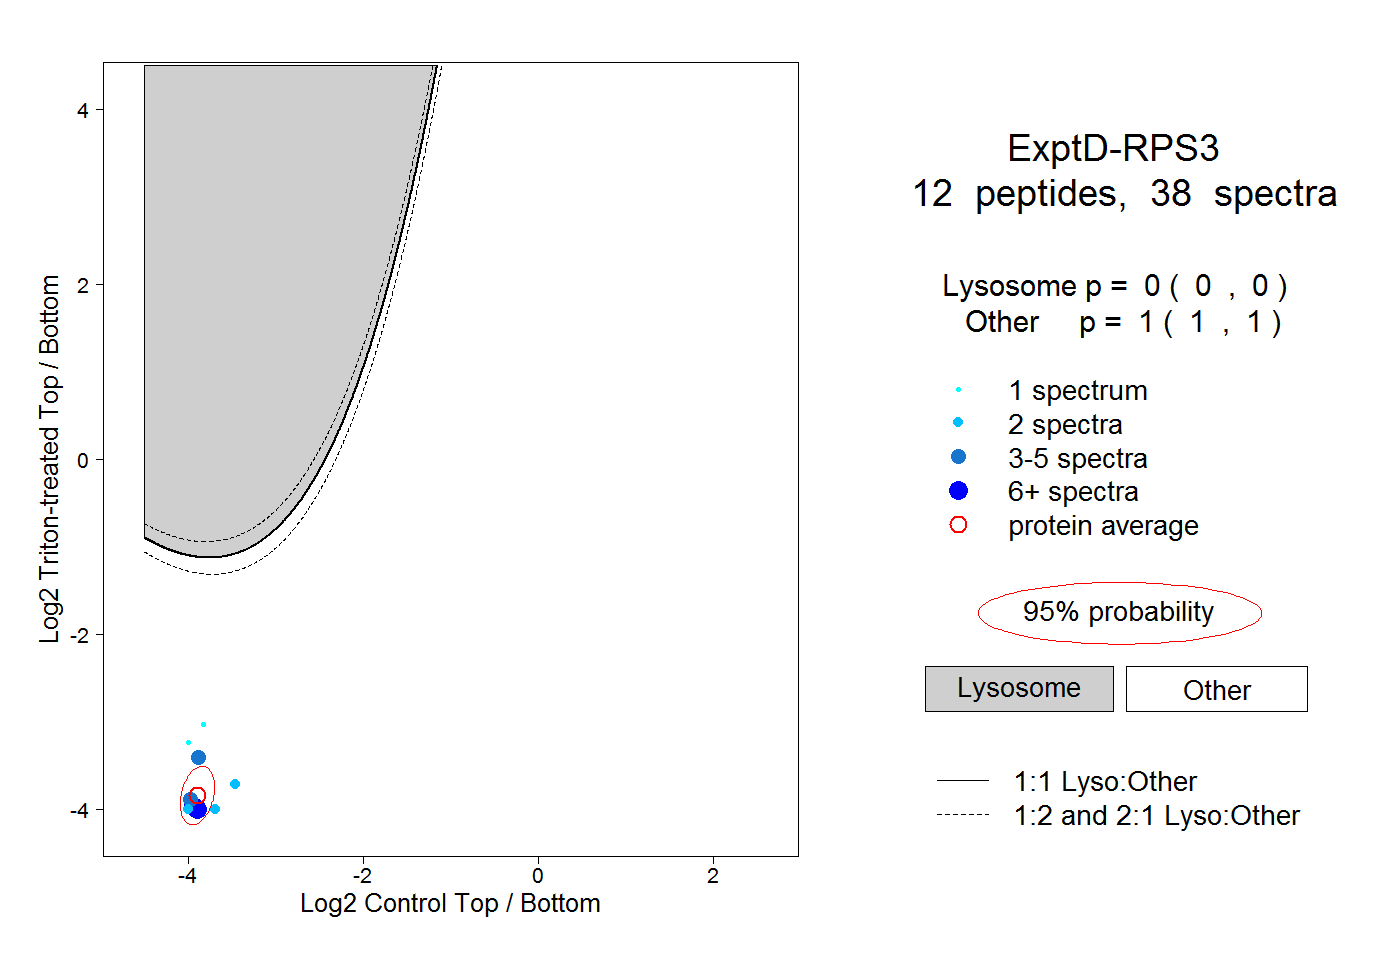
0.000 | 0.000
1.000 | 1.000