COG4
[ENSRNOP00000023924]
Main page
| | | Plot |
Mito |
Lyso |
|
Perox |
ER |
Golgi |
PM |
Cytosol |
Nucleus |
|
| Expt A |
 9
9
peptides |
25
spectra |
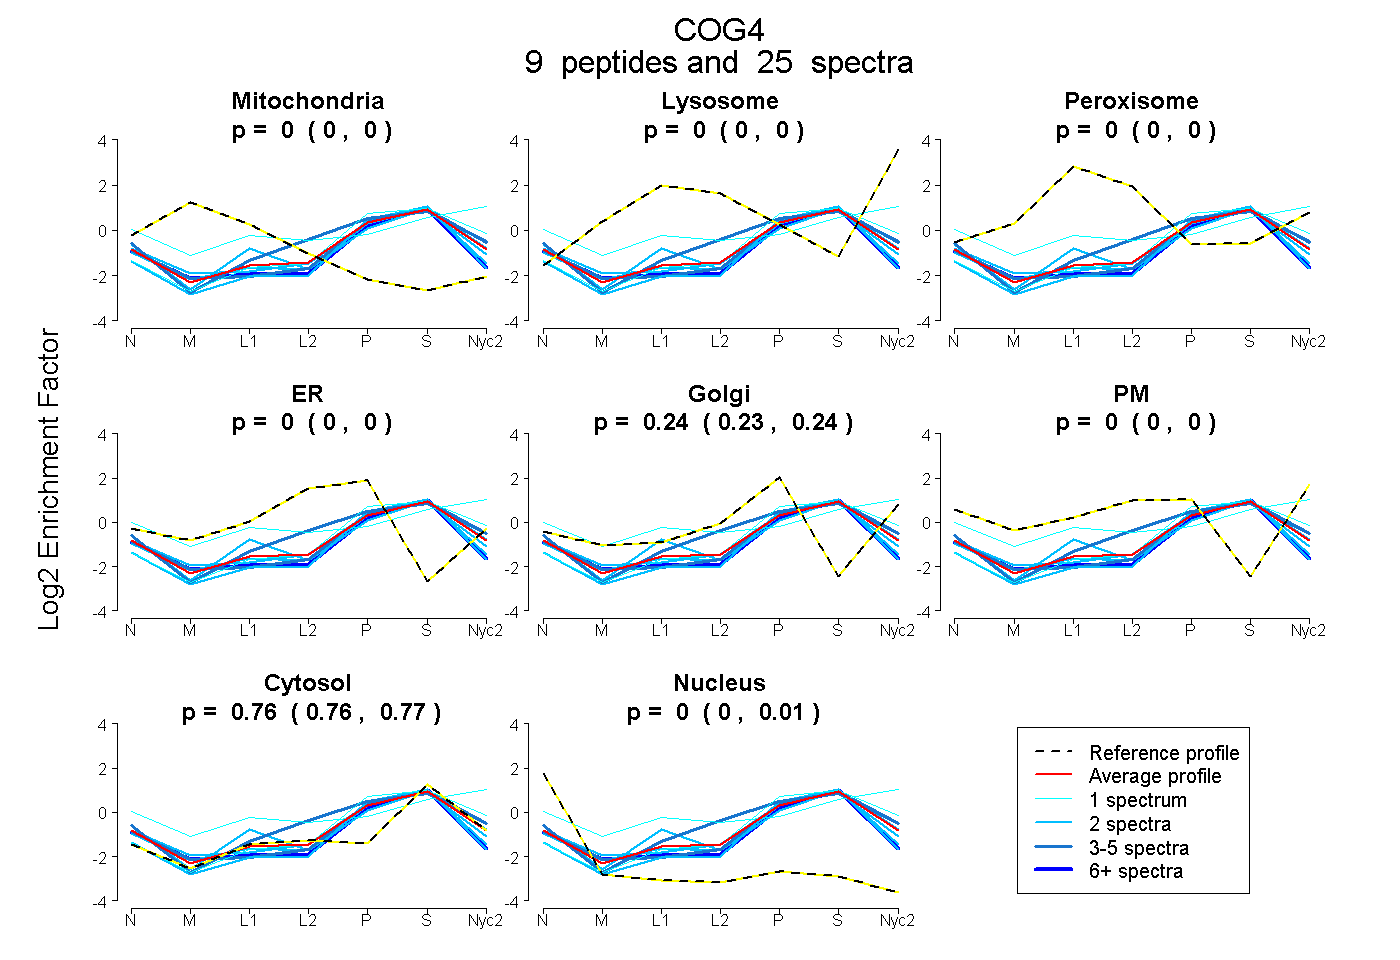 |
0.000
0.000 | 0.000 |
0.000
0.000 | 0.000 |
|
0.000
0.000 | 0.000 |
0.000
0.000 | 0.000 |
0.237
0.228 | 0.243 |
0.000
0.000 | 0.000 |
0.762
0.755 | 0.766 |
0.001
0.000 | 0.009 |
|
| | | Plot |
Mito |
|
Lyso or Perox |
|
ER |
Golgi |
PM |
Cytosol |
Nucleus |
|
| Expt B |
3
peptides |
3
spectra |
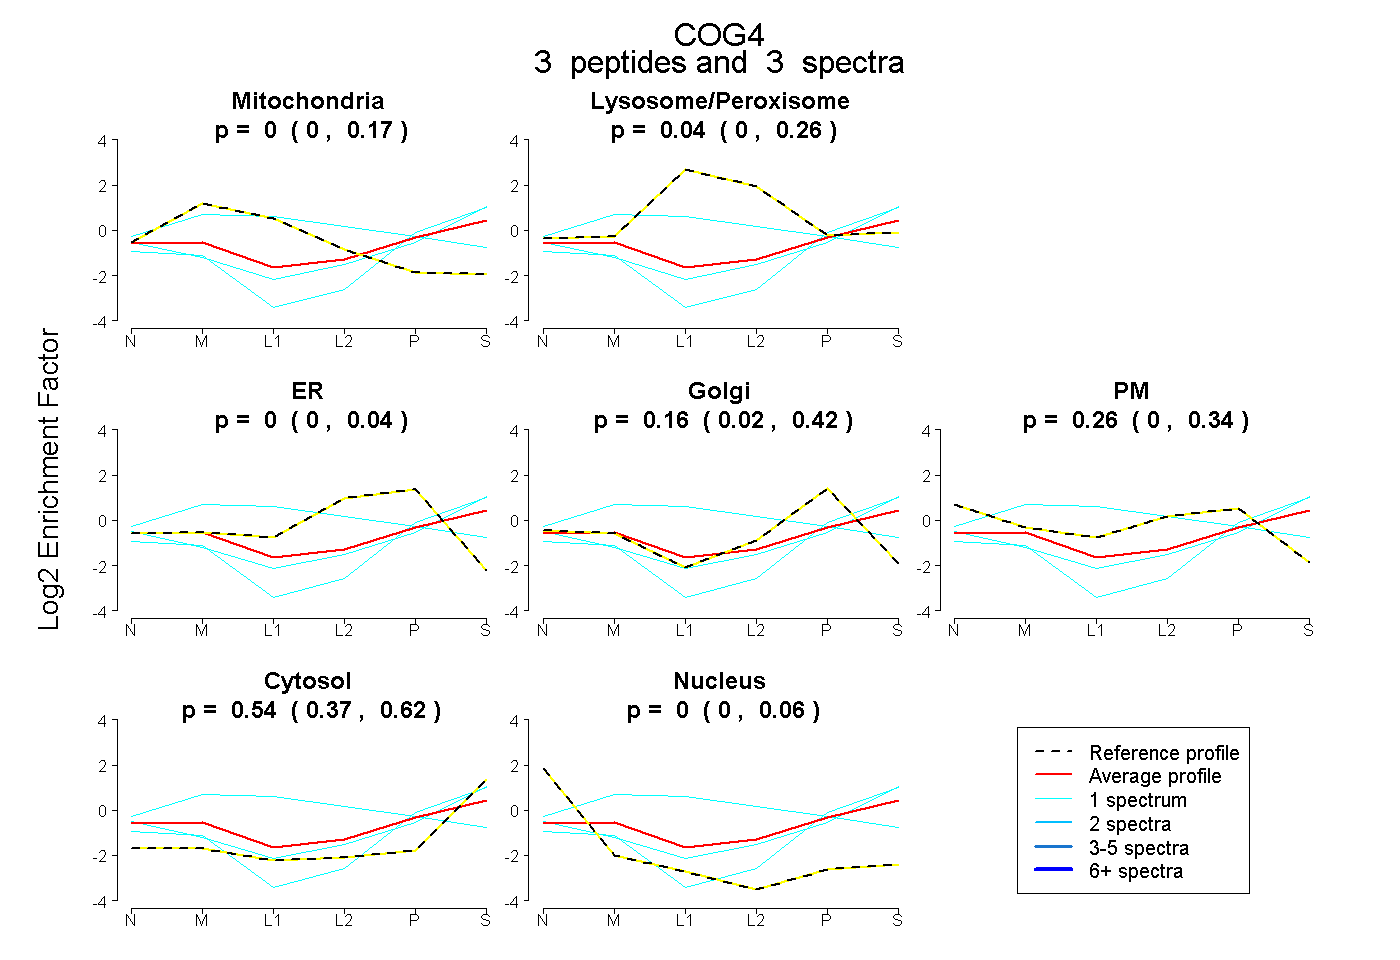 |
0.000
0.000 | 0.174 |
|
0.043
0.000 | 0.256 |
|
0.000
0.000 | 0.044 |
0.165
0.019 | 0.416 |
0.257
0.000 | 0.337 |
0.536
0.374 | 0.617 |
0.000
0.000 | 0.062 |
|
| | | Plot |
|
Lyso |
|
|
|
|
|
|
|
Other |
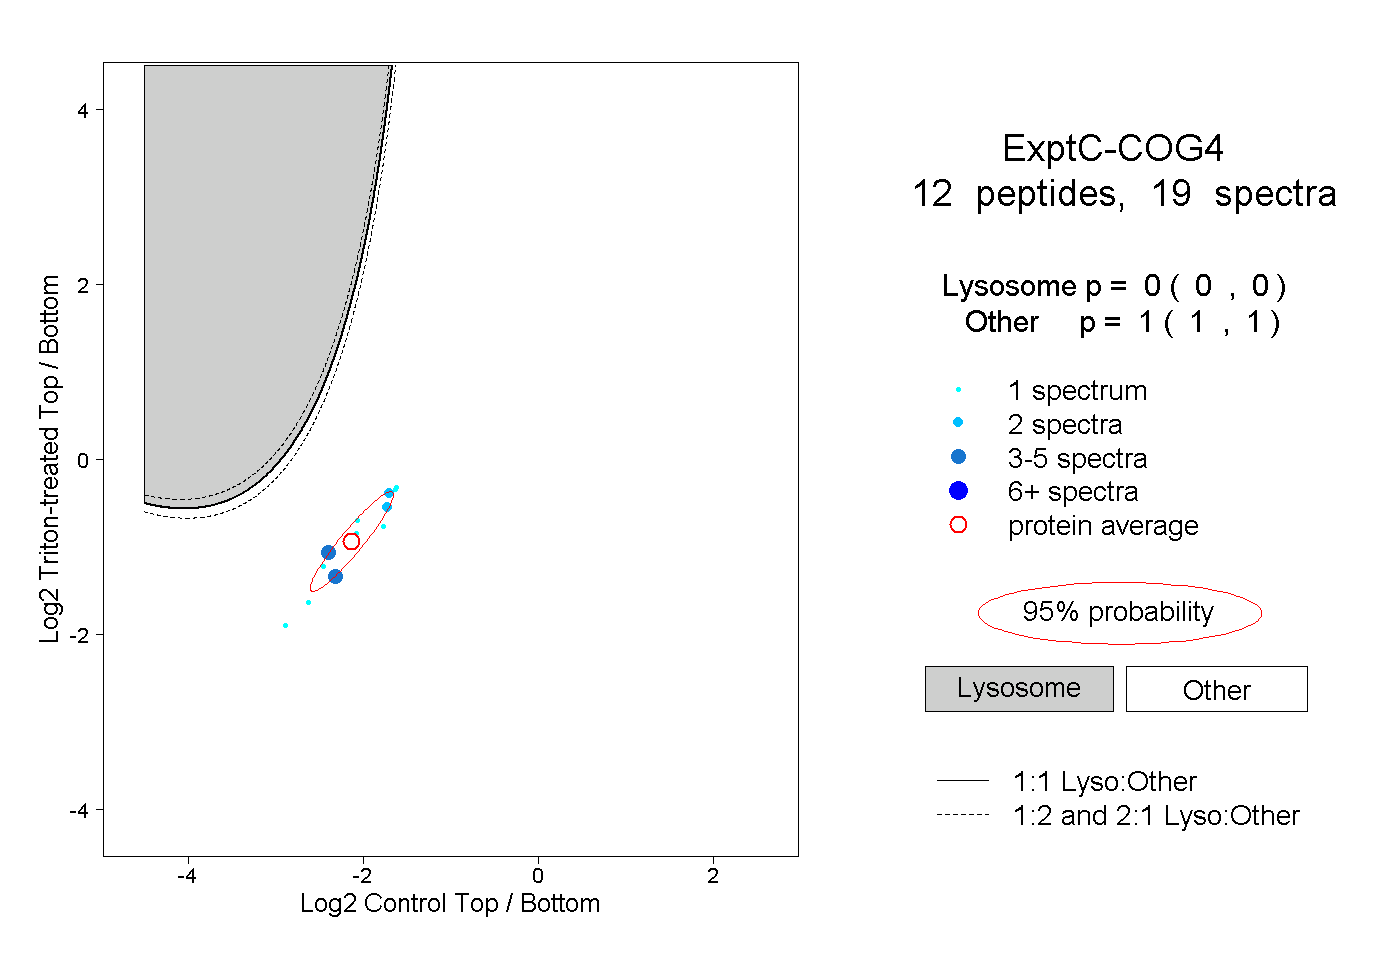
| Expt C |
12
peptides |
19
spectra |
 |
|
0.000
0.000 | 0.000 |
|
|
|
|
|
|
|
1.000
1.000 | 1.000 |
| 1 spectrum, TLESDCTK |
|
0.000 |
|
|
|
|
|
|
|
1.000 |
| 3 spectra, SVIEISR |
|
0.000 |
|
|
|
|
|
|
|
1.000 |
| 1 spectrum, SELYLR |
|
0.000 |
|
|
|
|
|
|
|
1.000 |
| 4 spectra, LTPAEVR |
|
0.000 |
|
|
|
|
|
|
|
1.000 |
| 1 spectrum, EGSMIDANLK |
|
0.000 |
|
|
|
|
|
|
|
1.000 |
| 1 spectrum, QVLALR |
|
0.000 |
|
|
|
|
|
|
|
1.000 |
| 1 spectrum, LYQAIQR |
|
0.000 |
|
|
|
|
|
|
|
1.000 |
| 1 spectrum, LGGLQFDK |
|
0.000 |
|
|
|
|
|
|
|
1.000 |
| 1 spectrum, LFTLIK |
|
0.000 |
|
|
|
|
|
|
|
1.000 |
| 2 spectra, GIESTDEAK |
|
0.000 |
|
|
|
|
|
|
|
1.000 |
| 1 spectrum, ADDILDLK |
|
0.000 |
|
|
|
|
|
|
|
1.000 |
| 2 spectra, EGDLPQVER |
|
0.000 |
|
|
|
|
|
|
|
1.000 |
| | | Plot |
|
Lyso |
|
|
|
|
|
|
|
Other |
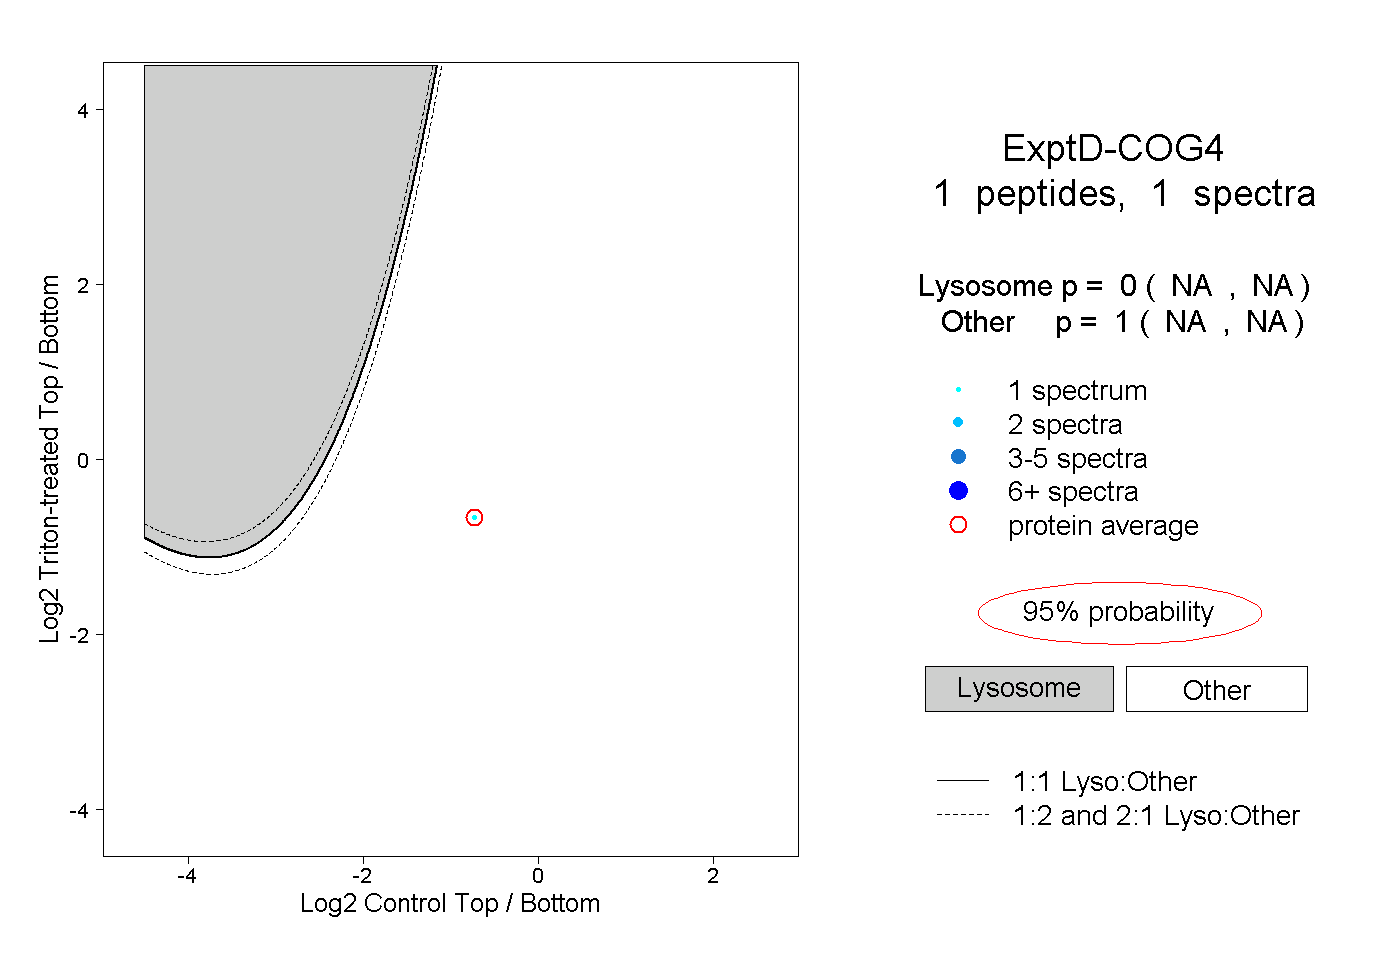
| Expt D |
1
peptide |
1
spectrum |
 |
|
0.000
NA | NA |
|
|
|
|
|
|
|
1.000
NA | NA |