 9
9peptides
spectra
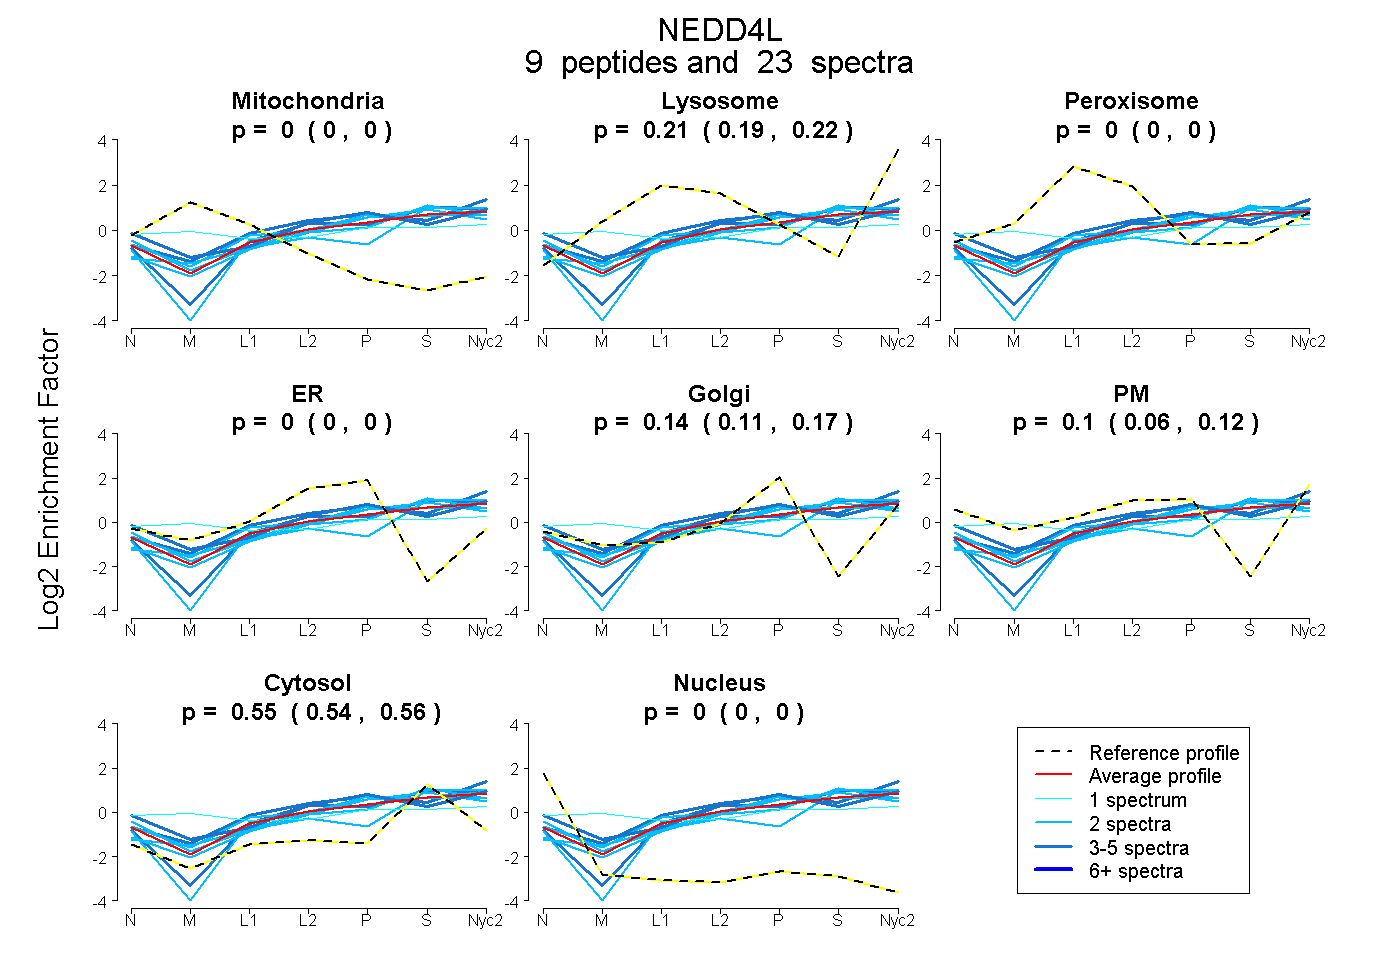
0.000 | 0.000
0.194 | 0.223
0.000 | 0.000
0.000 | 0.000
0.112 | 0.169
0.061 | 0.123
0.540 | 0.562
0.000 | 0.000
1peptide
spectrum
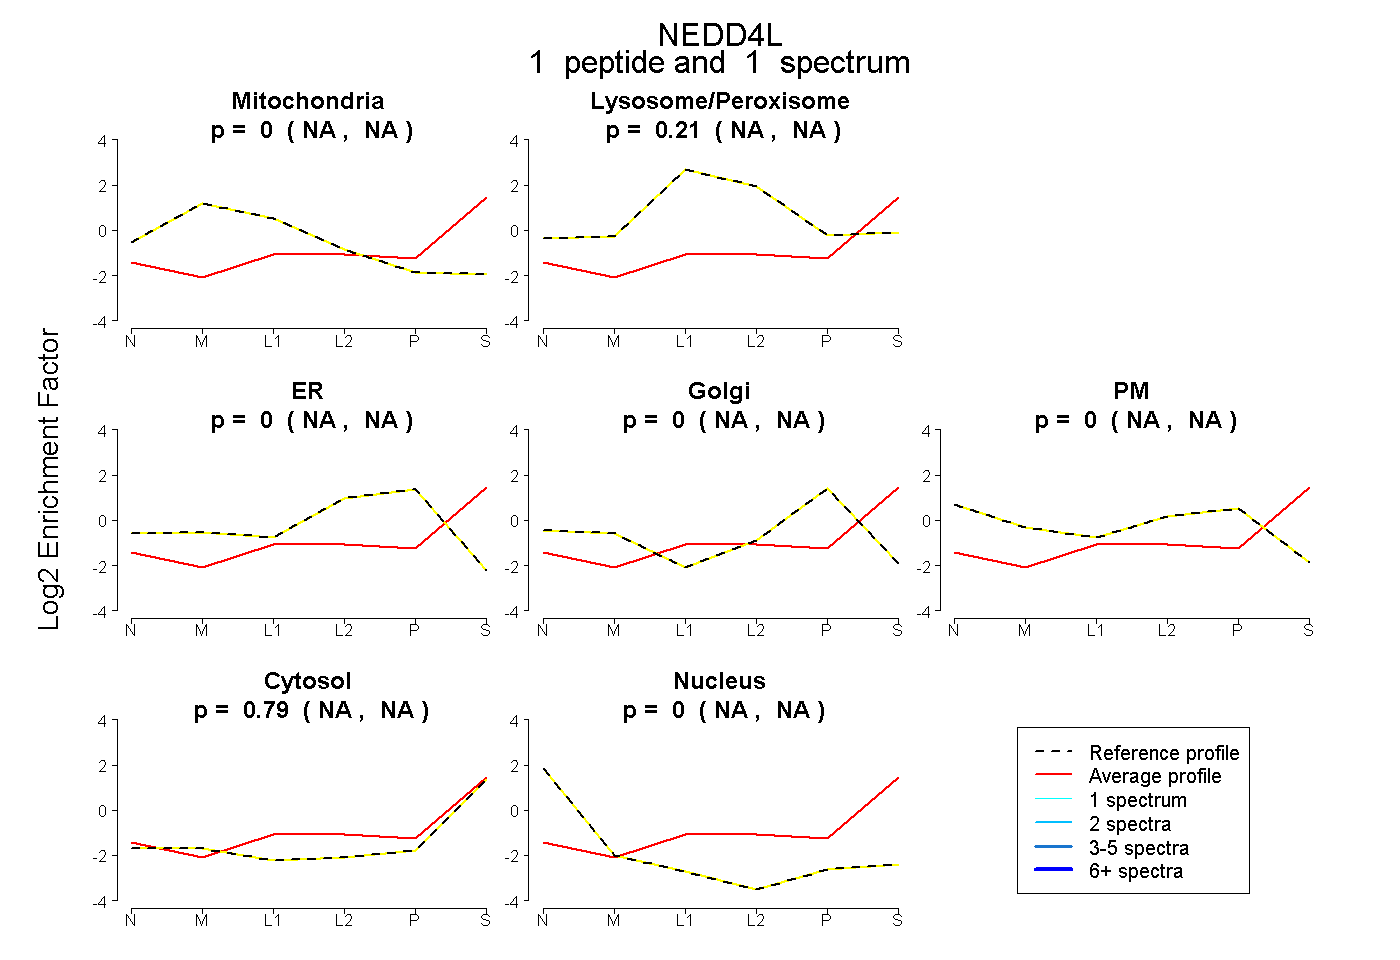
NA | NA
NA | NA
NA | NA
NA | NA
NA | NA
NA | NA
NA | NA
7peptides
spectra
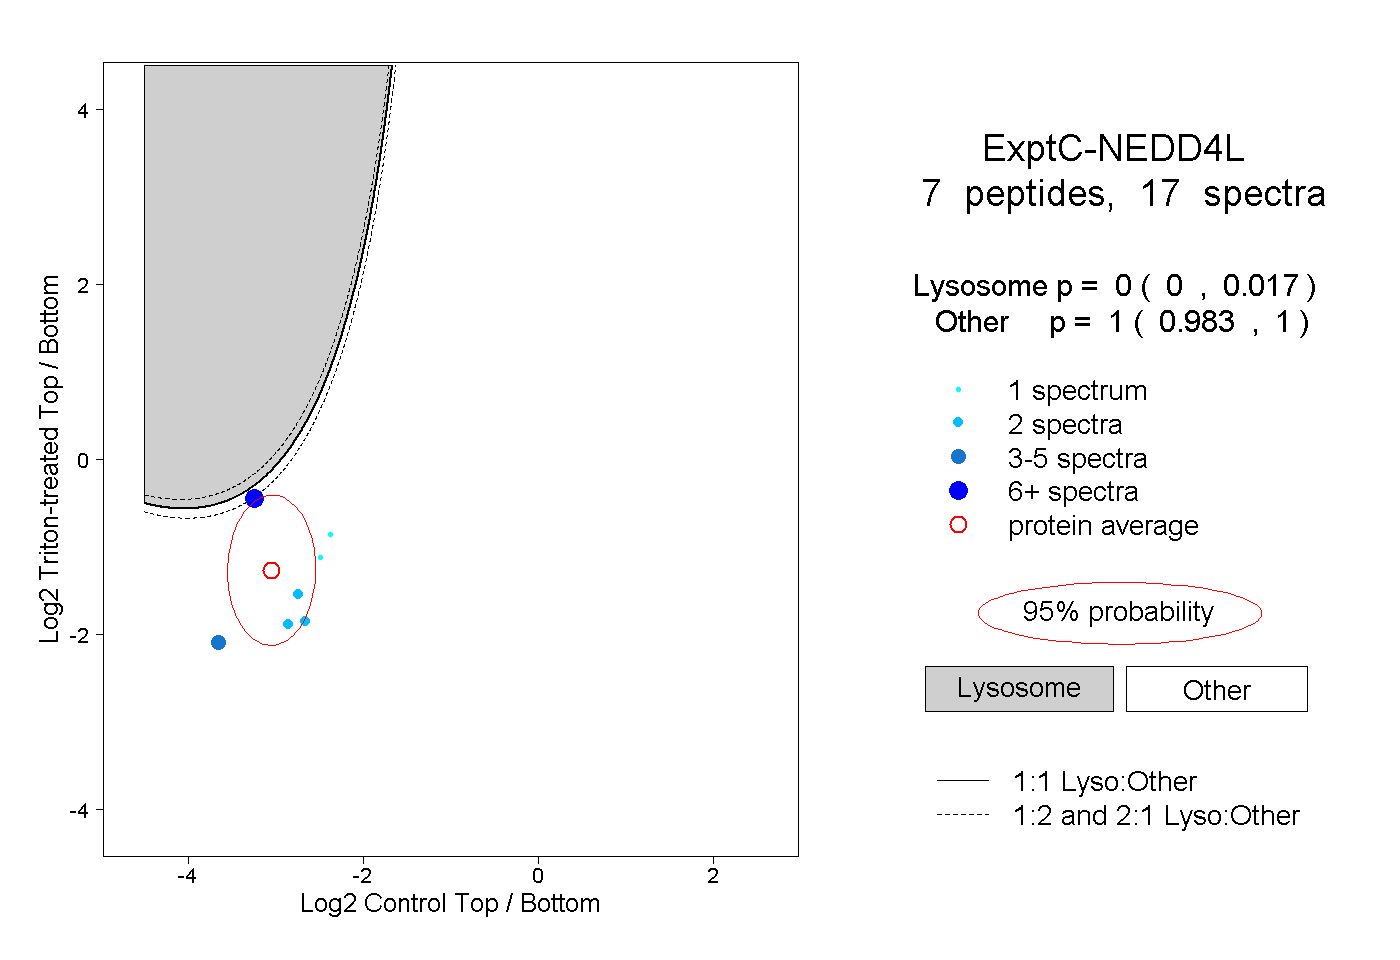
0.000 | 0.017
0.983 | 1.000
2peptides
spectra

0.000 | 0.003
0.997 | 1.000