11
11peptides
spectra

0.047 | 0.077
0.061 | 0.106
0.241 | 0.290
0.000 | 0.000
0.000 | 0.001
0.427 | 0.465
0.121 | 0.146
0.000 | 0.000
9peptides
spectra
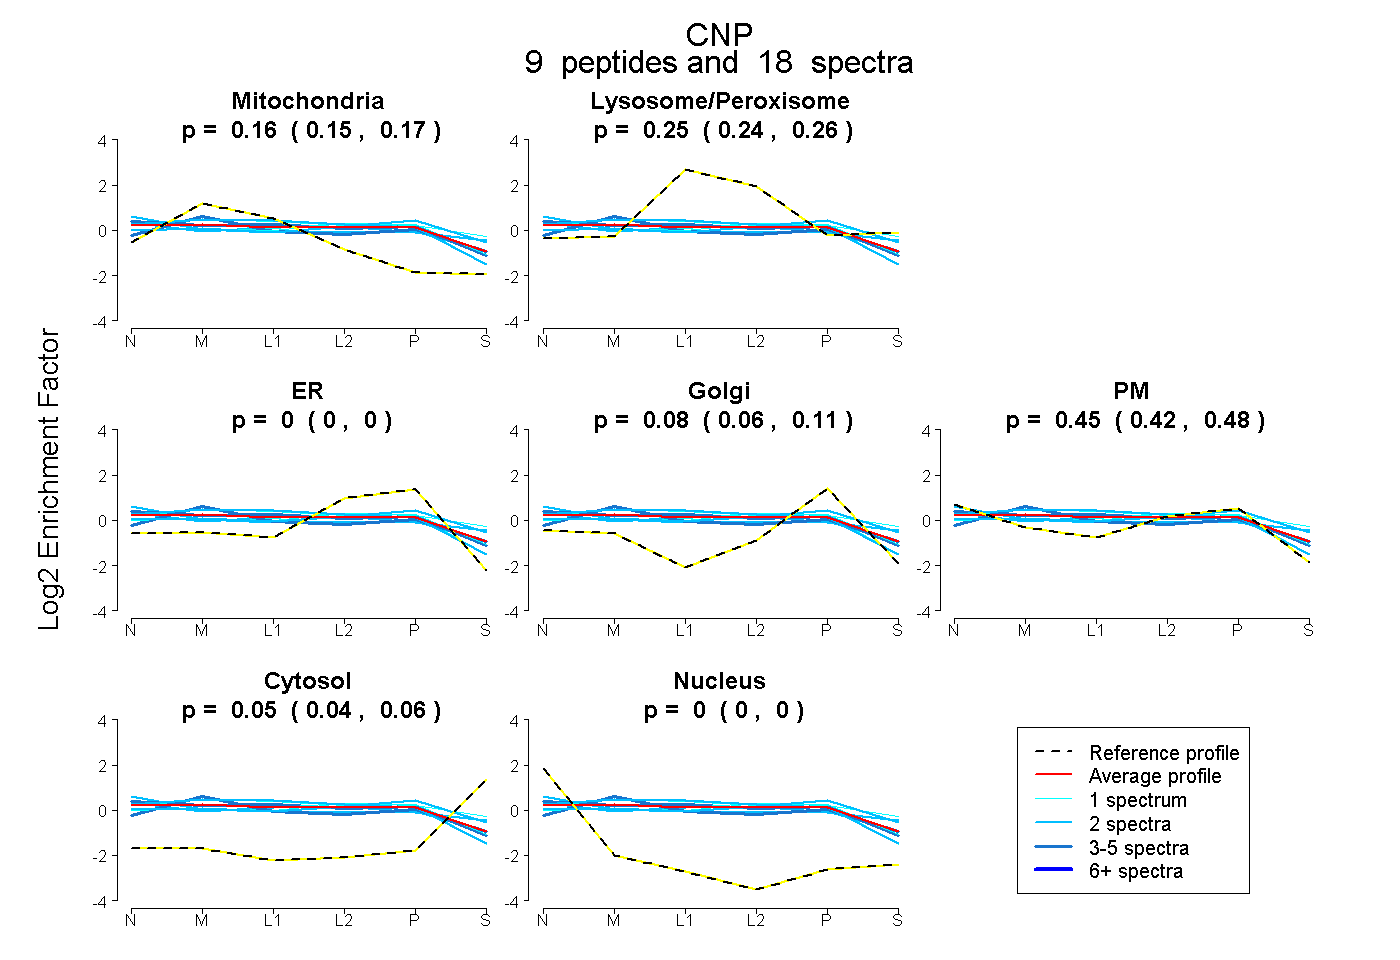
0.147 | 0.174
0.240 | 0.261
0.000 | 0.000
0.060 | 0.107
0.417 | 0.481
0.038 | 0.059
0.000 | 0.000