20
20peptides
spectra
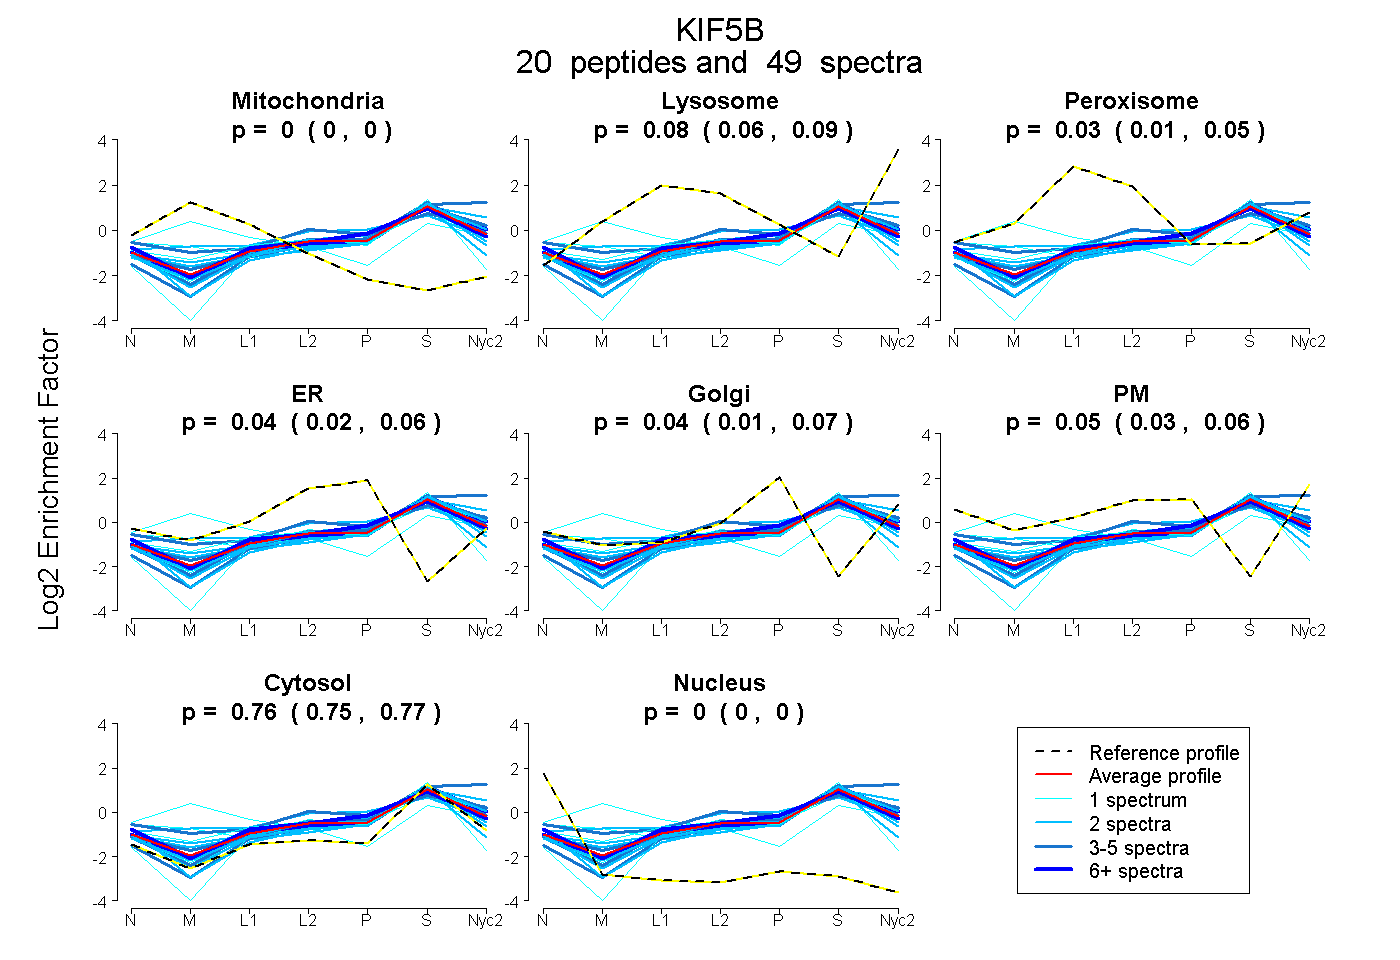
0.000 | 0.000
0.065 | 0.089
0.011 | 0.049
0.019 | 0.058
0.010 | 0.065
0.033 | 0.062
0.751 | 0.769
0.000 | 0.000
8peptides
spectra
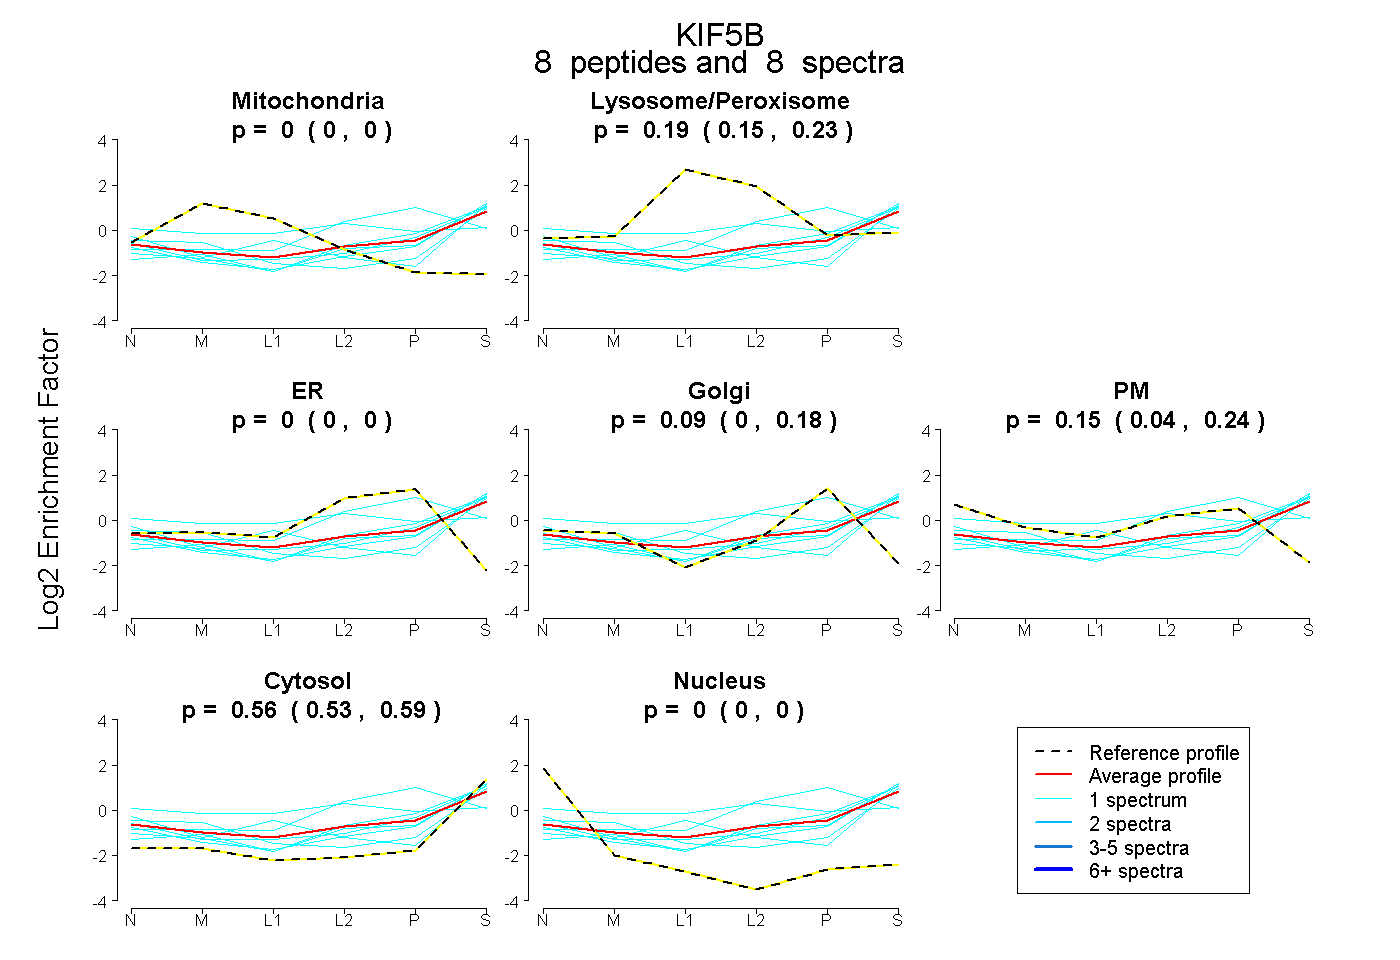
0.000 | 0.000
0.152 | 0.232
0.000 | 0.000
0.000 | 0.184
0.035 | 0.235
0.527 | 0.595
0.000 | 0.000