 5
5peptides
spectra
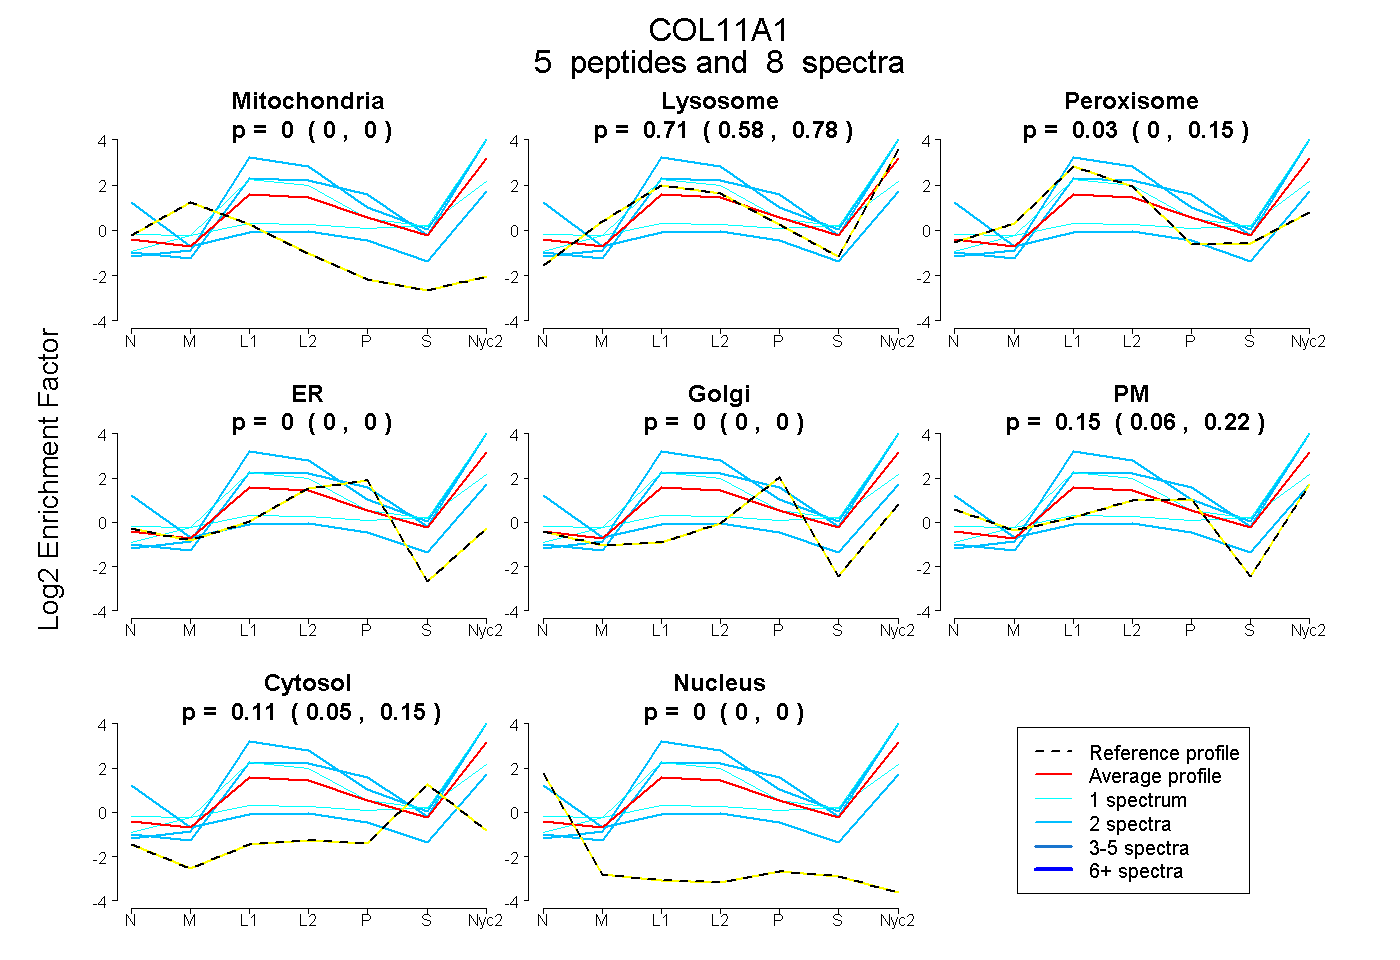
0.000 | 0.000
0.583 | 0.785
0.000 | 0.150
0.000 | 0.000
0.000 | 0.000
0.056 | 0.217
0.051 | 0.150
0.000 | 0.000
2peptides
spectra
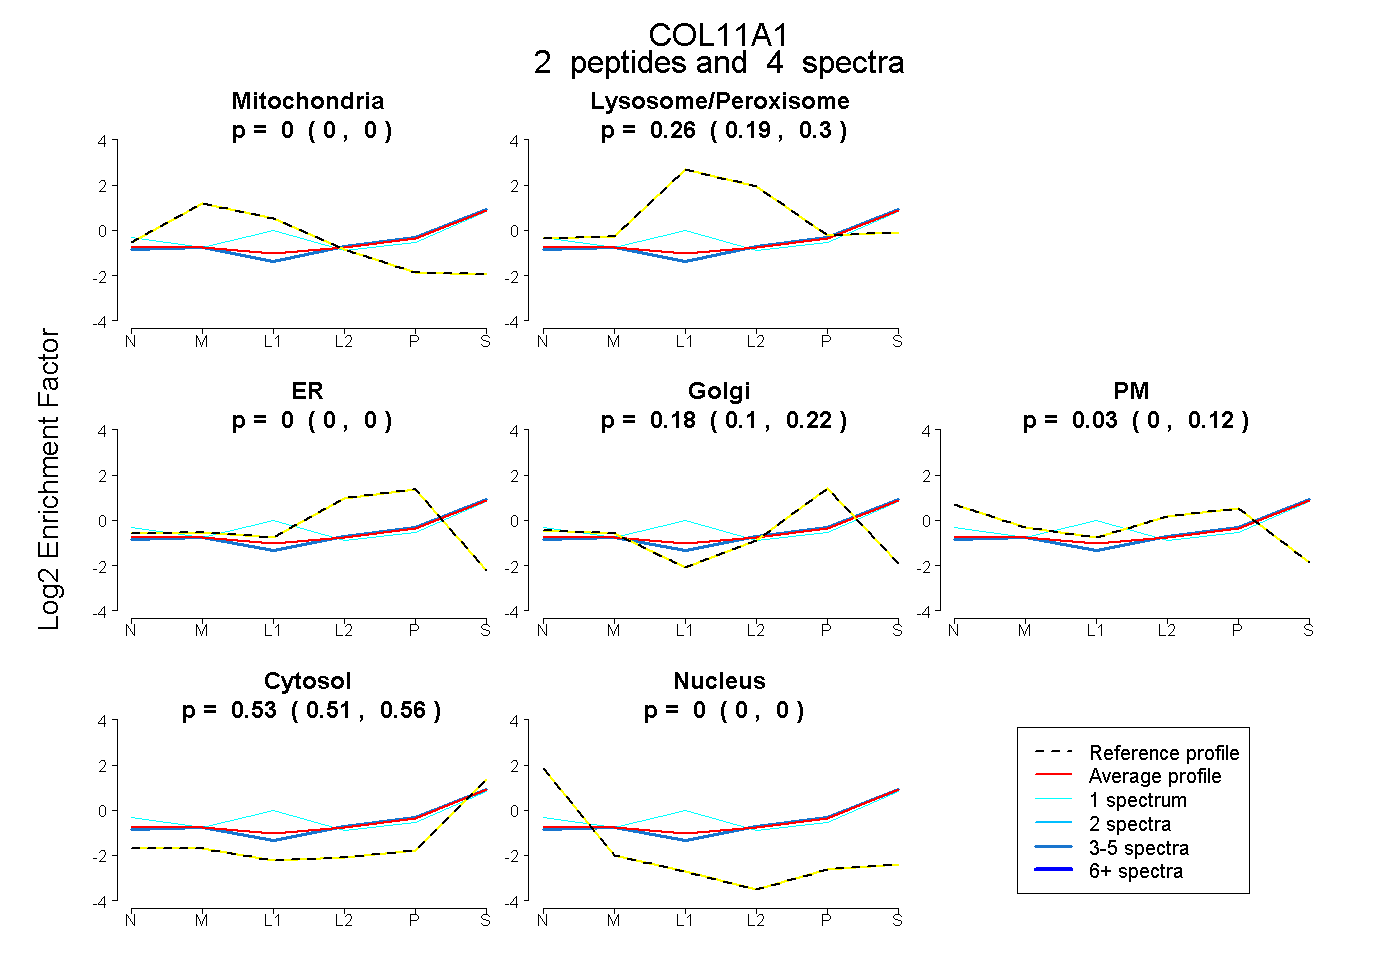
0.000 | 0.000
0.189 | 0.303
0.000 | 0.000
0.096 | 0.219
0.000 | 0.122
0.510 | 0.557
0.000 | 0.000
2peptides
spectra
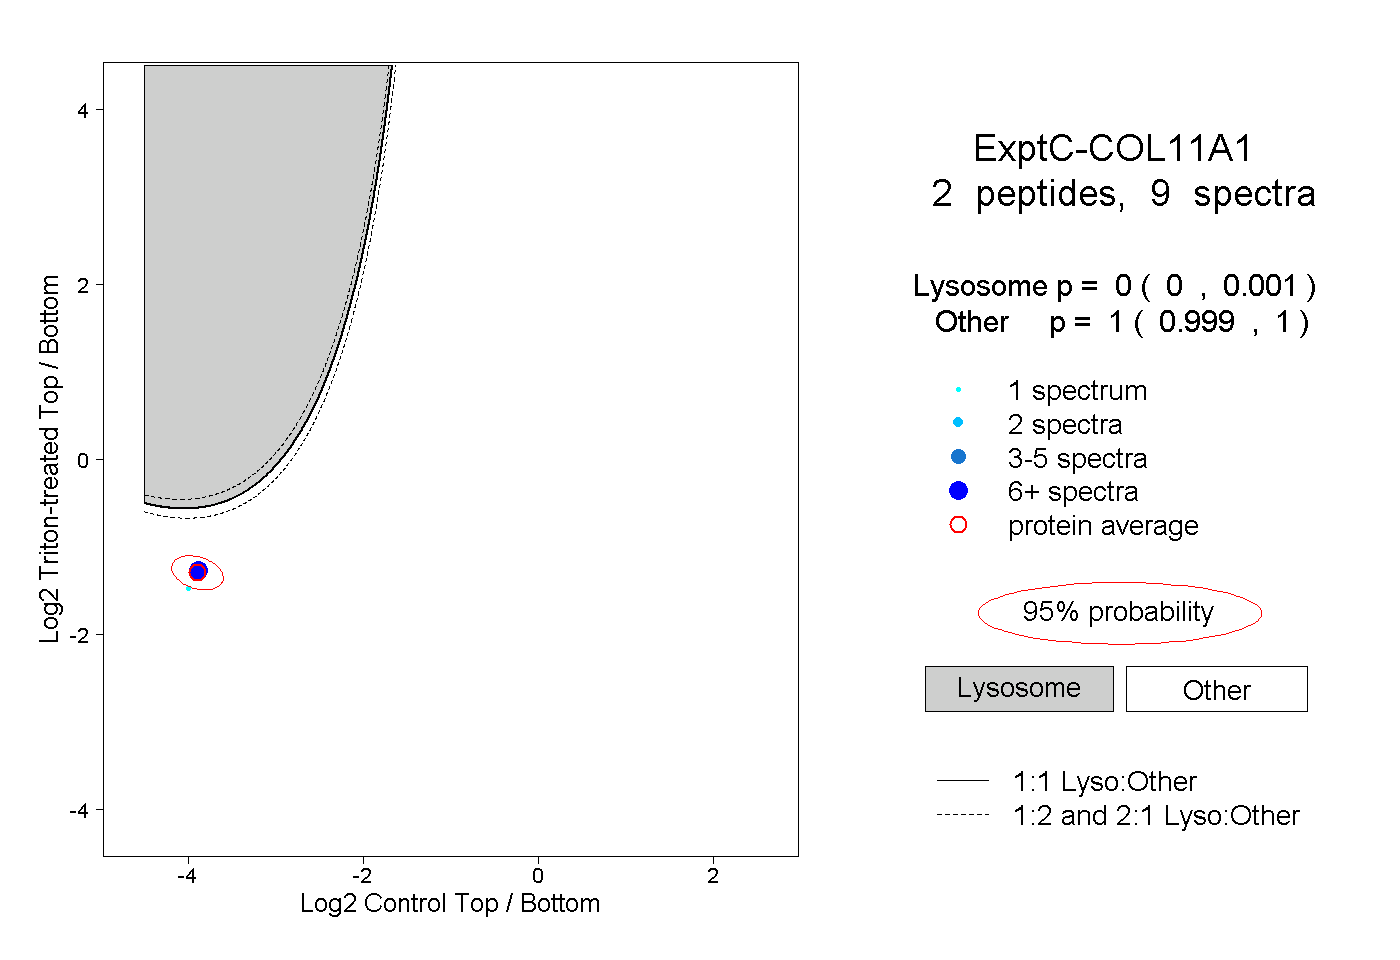
0.000 | 0.001
0.999 | 1.000
1peptide
spectrum

NA | NA
NA | NA