 4
4peptides
spectra
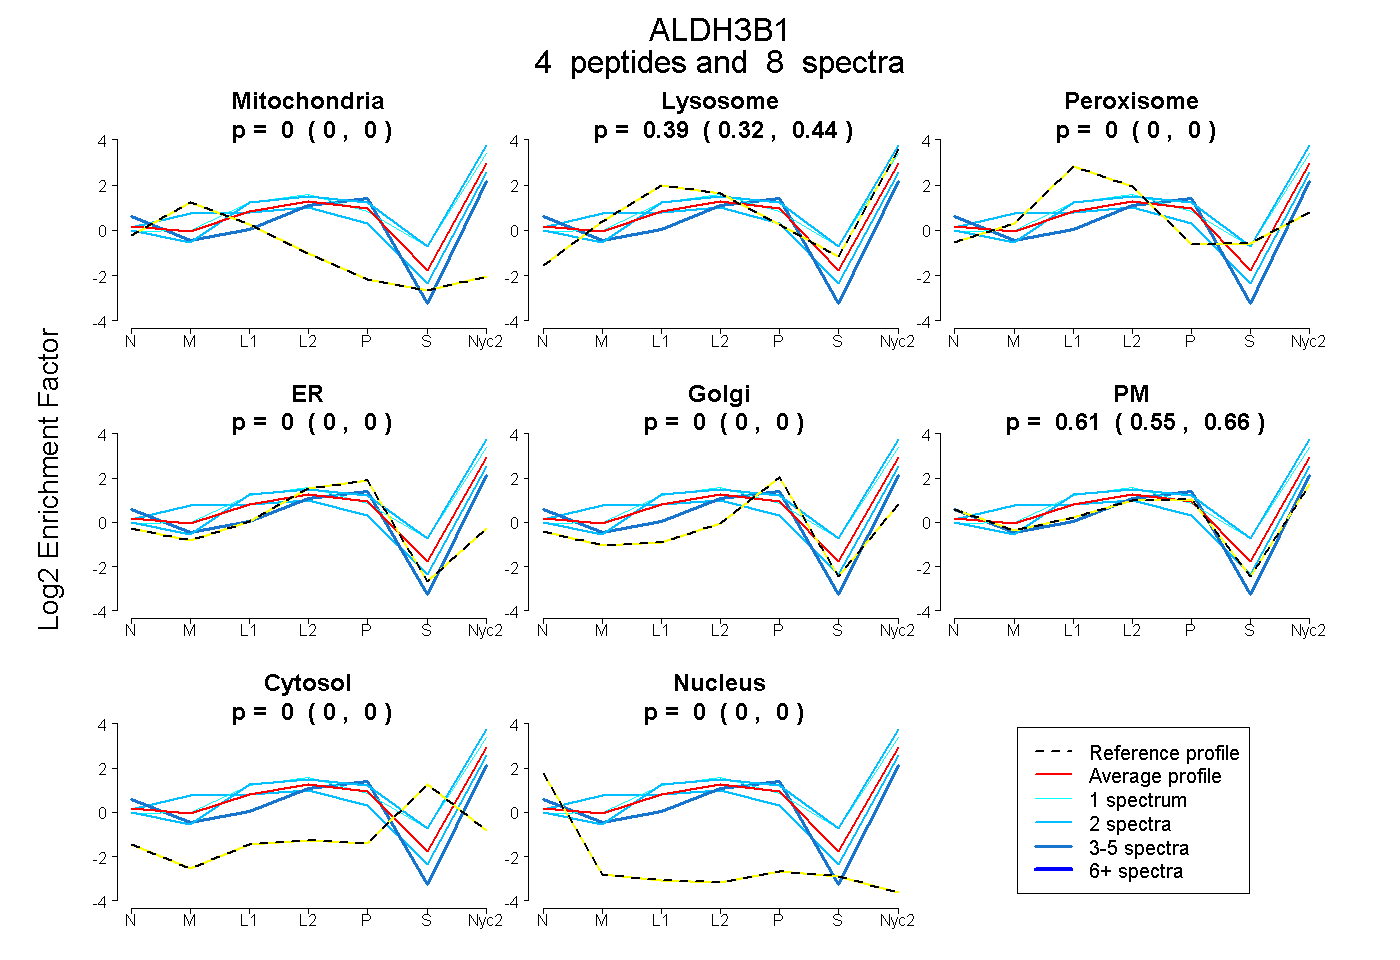
0.000 | 0.000
0.324 | 0.443
0.000 | 0.000
0.000 | 0.000
0.000 | 0.000
0.548 | 0.664
0.000 | 0.000
0.000 | 0.000
10peptides
spectra
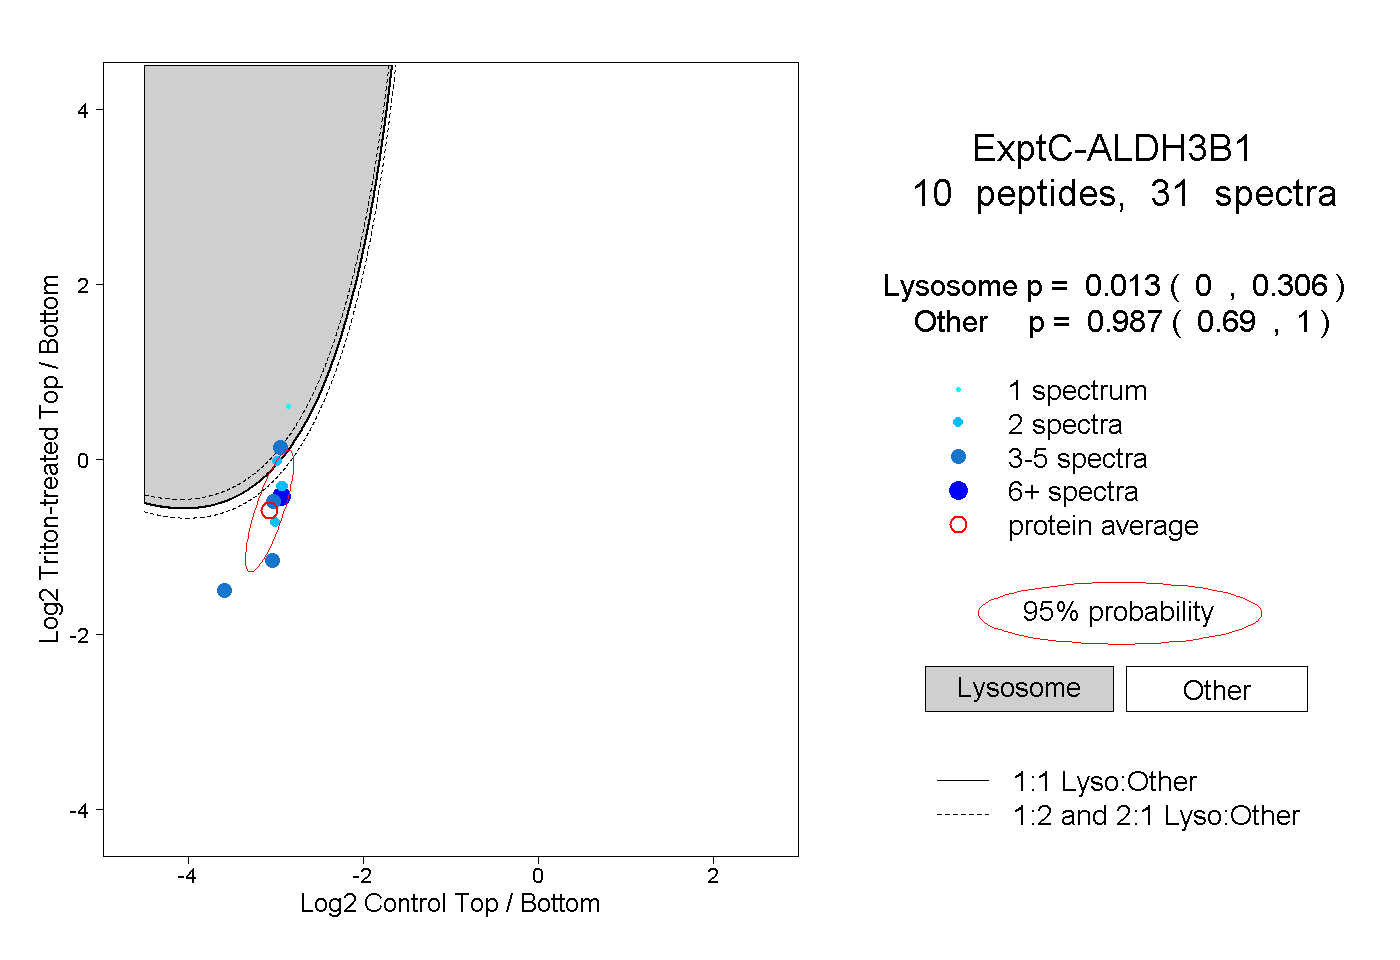
0.000 | 0.306
0.690 | 1.000
2peptides
spectra
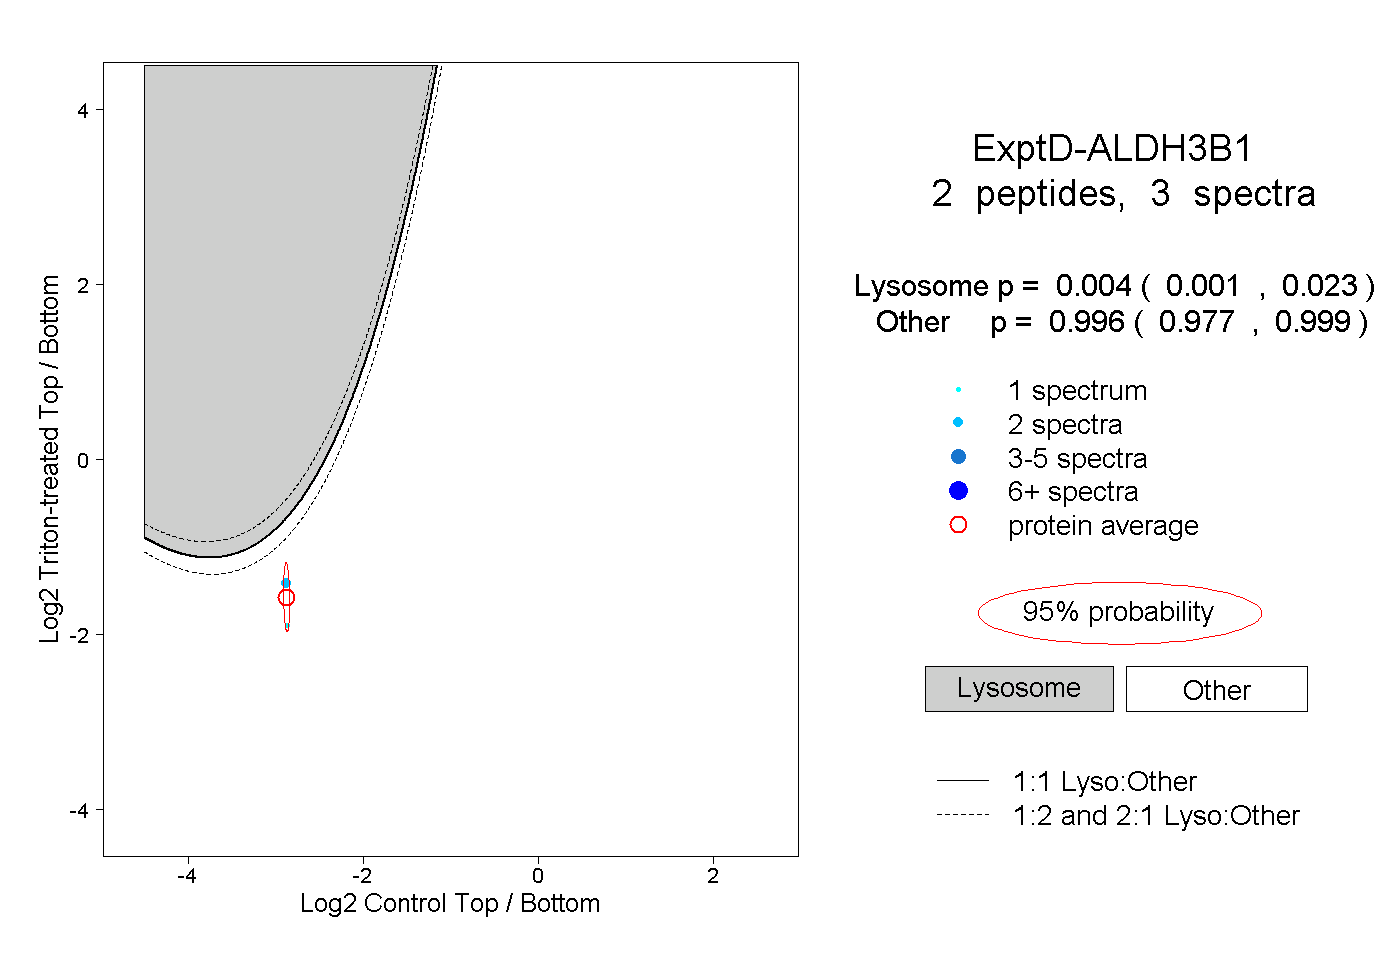
0.001 | 0.023
0.977 | 0.999