 1
1peptide
spectrum
NA | NA
NA | NA
NA | NA
NA | NA
NA | NA
NA | NA
NA | NA
3peptides
spectra
0.831 | 1.000
0.000 | 0.163
2peptides
spectra
0.000 | 0.054
0.944 | 1.000
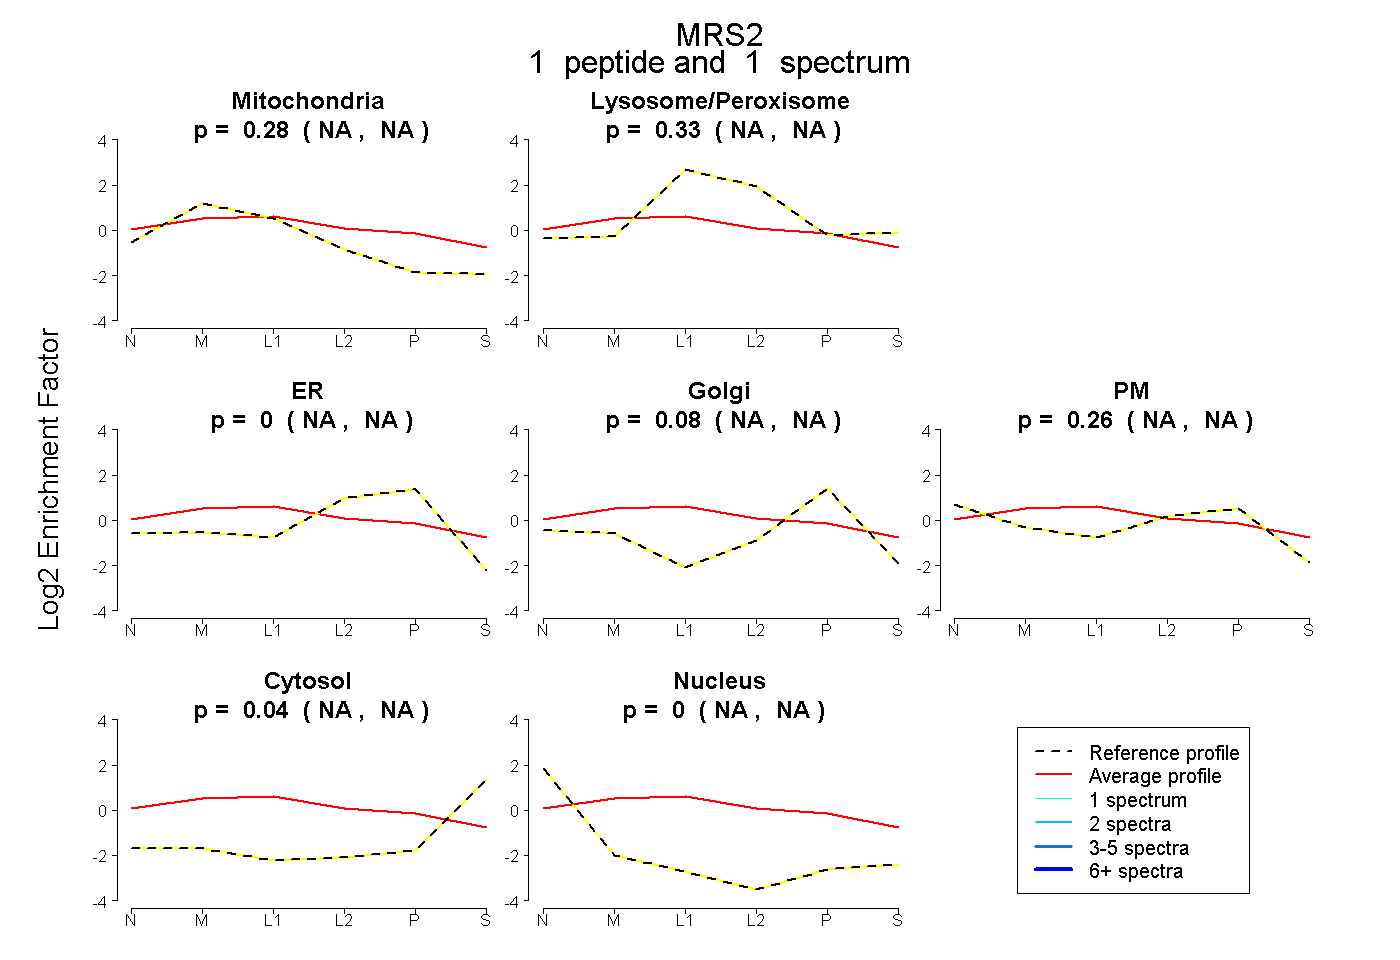
| Plot | Mito | Lyso or Perox | ER | Golgi | PM | Cytosol | Nucleus | ||||||
| Expt B |
1 peptide |
1 spectrum |
|
0.281 NA | NA |
0.332 NA | NA |
0.000 NA | NA |
0.083 NA | NA |
0.262 NA | NA |
0.041 NA | NA |
0.000 NA | NA |
|||
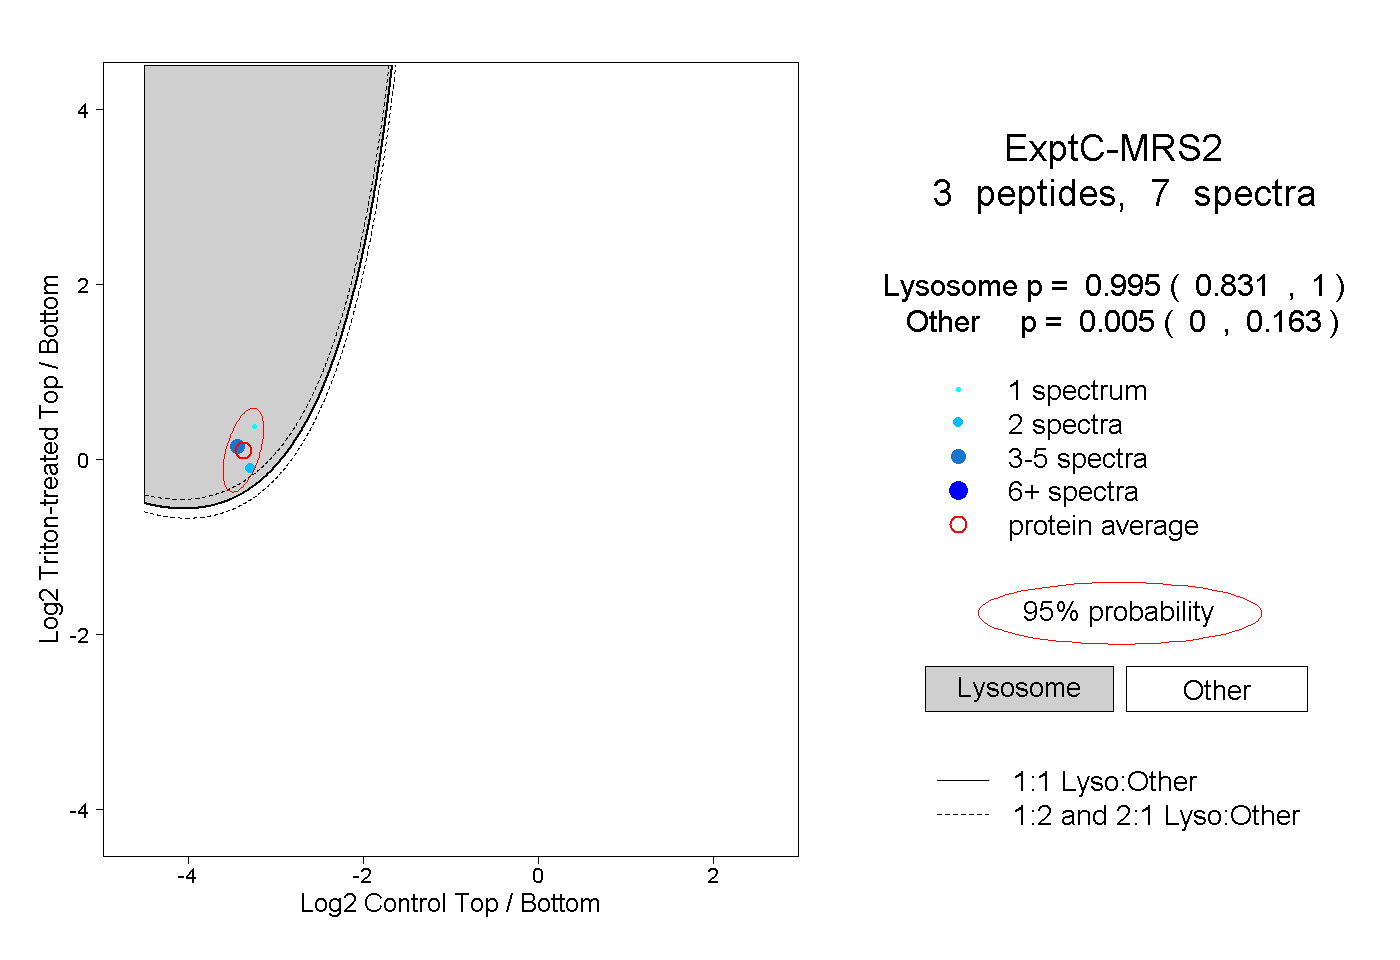
| Plot | Lyso | Other | |||||||||||
| Expt C |
3 peptides |
7 spectra |
|
0.995 0.831 | 1.000 |
0.005 0.000 | 0.163 |
||||||||
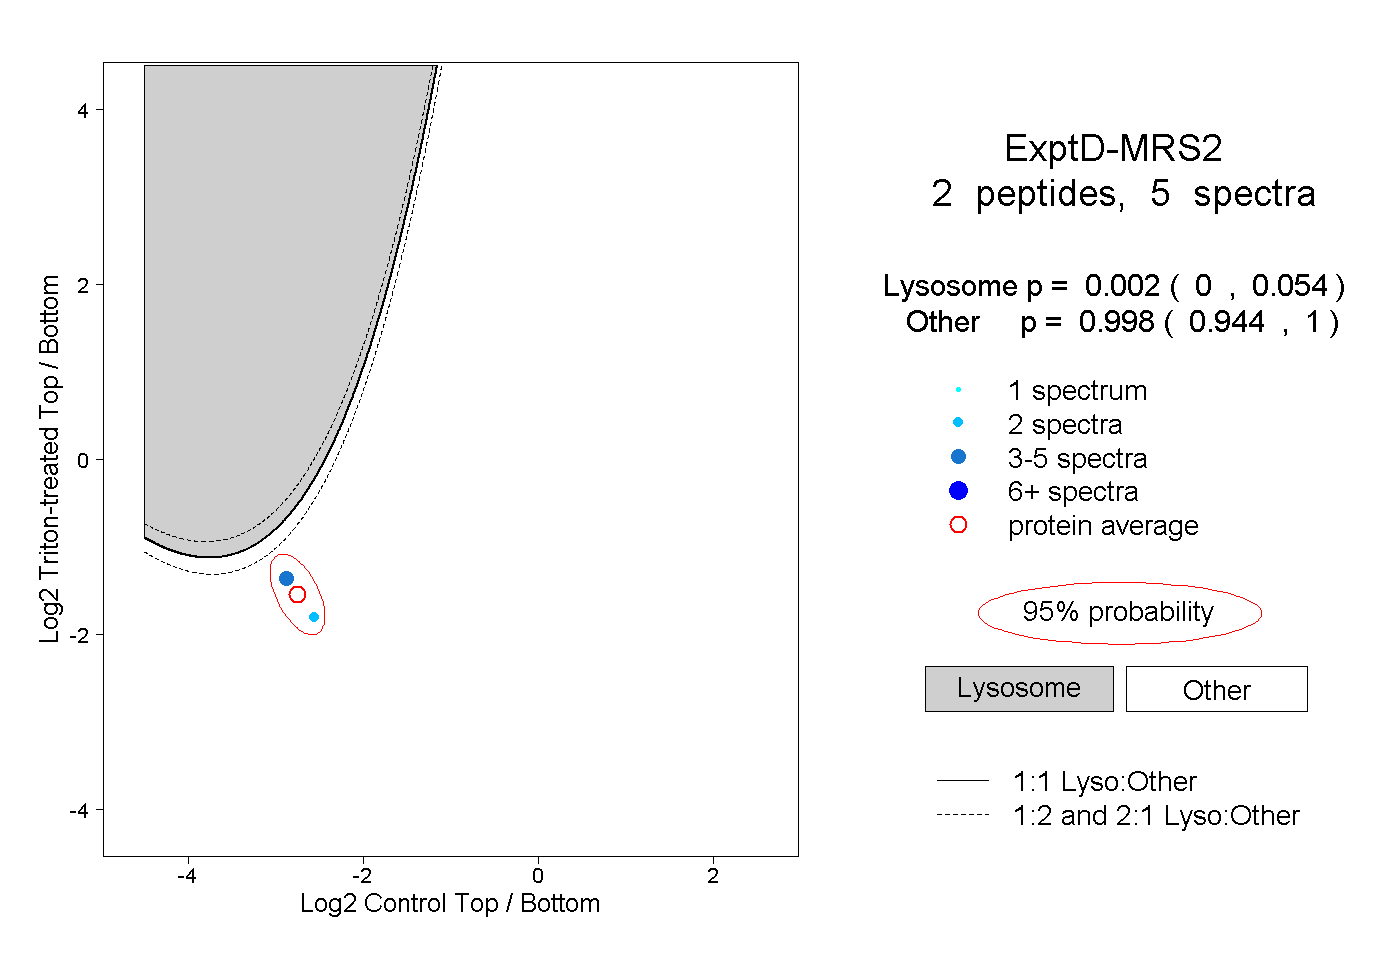
| Plot | Lyso | Other | |||||||||||
| Expt D |
2 peptides |
5 spectra |
|
0.002 0.000 | 0.054 |
0.998 0.944 | 1.000 |