 13
13peptides
spectra
0.000 | 0.000
0.000 | 0.000
0.000 | 0.000
0.000 | 0.000
0.344 | 0.355
0.000 | 0.000
0.555 | 0.564
0.085 | 0.094
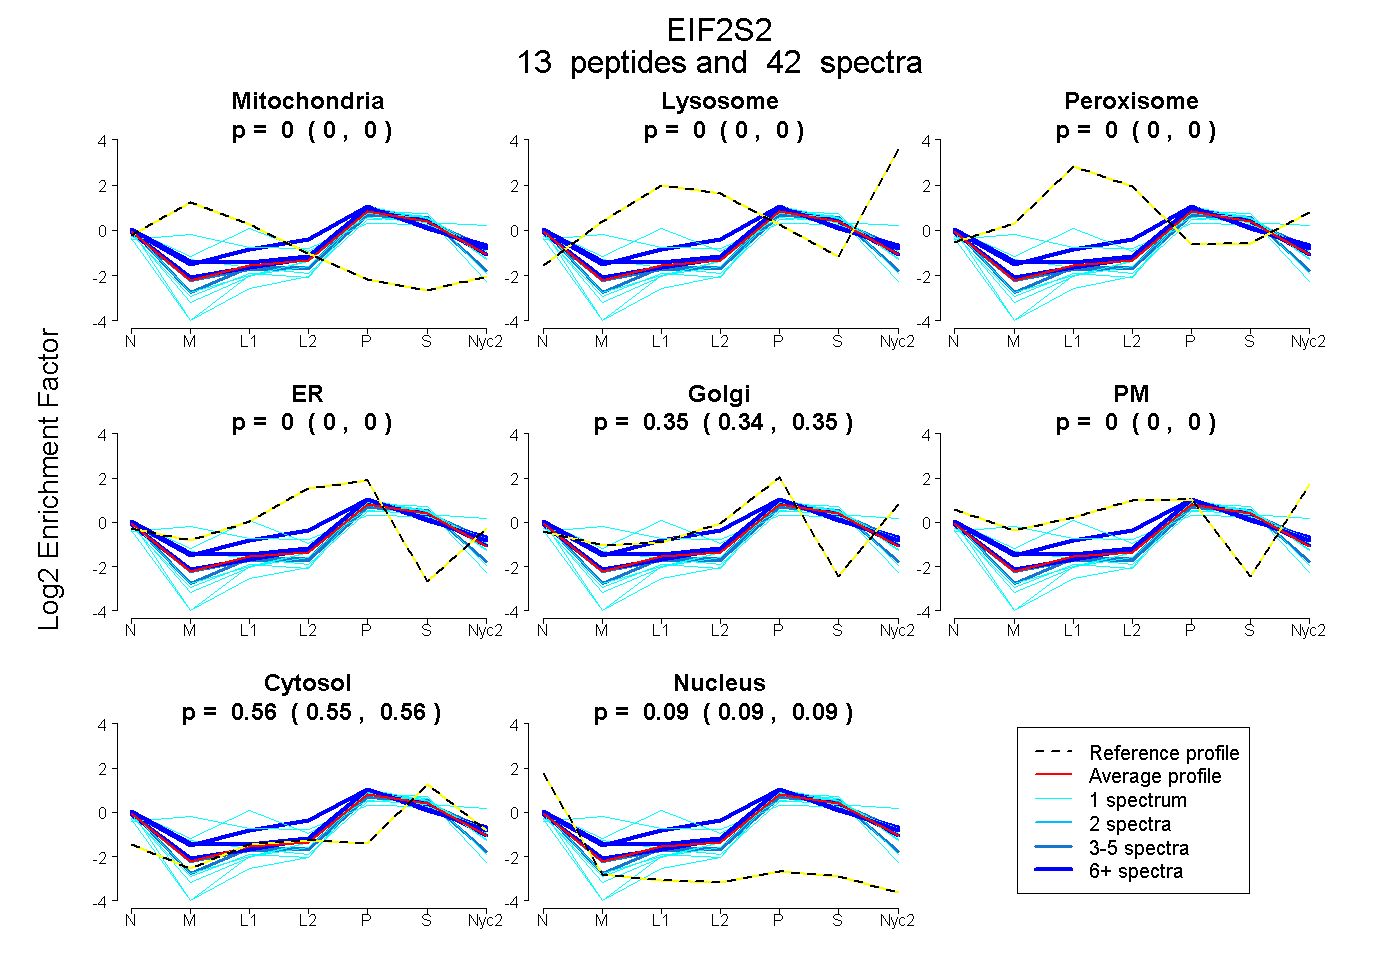
| Plot | Mito | Lyso | Perox | ER | Golgi | PM | Cytosol | Nucleus | |||||
| Expt A |
13 peptides |
42 spectra |
|
0.000 0.000 | 0.000 |
0.000 0.000 | 0.000 |
0.000 0.000 | 0.000 |
0.000 0.000 | 0.000 |
0.350 0.344 | 0.355 |
0.000 0.000 | 0.000 |
0.560 0.555 | 0.564 |
0.090 0.085 | 0.094 |
| 5 spectra, DYTYEELLNR | 0.000 | 0.000 | 0.000 | 0.000 | 0.253 | 0.000 | 0.588 | 0.159 | ||
| 1 spectrum, QIENVLR | 0.000 | 0.000 | 0.000 | 0.000 | 0.279 | 0.000 | 0.596 | 0.125 | ||
| 1 spectrum, SPDTILQK | 0.000 | 0.000 | 0.000 | 0.000 | 0.293 | 0.000 | 0.613 | 0.094 | ||
| 7 spectra, VFNIMR | 0.000 | 0.000 | 0.000 | 0.000 | 0.469 | 0.000 | 0.462 | 0.069 | ||
| 4 spectra, DASDDLDDLNFFNQK | 0.000 | 0.000 | 0.000 | 0.000 | 0.332 | 0.000 | 0.570 | 0.098 | ||
| 1 spectrum, NPDMVAGEK | 0.000 | 0.000 | 0.176 | 0.000 | 0.248 | 0.120 | 0.456 | 0.000 | ||
| 1 spectrum, EVEPEPAEEK | 0.000 | 0.000 | 0.000 | 0.000 | 0.154 | 0.000 | 0.689 | 0.158 | ||
| 1 spectrum, TSFVNFTDICK | 0.175 | 0.000 | 0.097 | 0.000 | 0.294 | 0.000 | 0.434 | 0.000 | ||
| 6 spectra, EYVTCHTCR | 0.000 | 0.000 | 0.000 | 0.294 | 0.214 | 0.000 | 0.492 | 0.000 | ||
| 1 spectrum, TGFQAVTGK | 0.000 | 0.000 | 0.000 | 0.000 | 0.222 | 0.000 | 0.601 | 0.177 | ||
| 12 spectra, FVMKPPQVVR | 0.000 | 0.000 | 0.000 | 0.000 | 0.376 | 0.000 | 0.545 | 0.079 | ||
| 1 spectrum, DDGISFSNQTGPAWAGSER | 0.000 | 0.000 | 0.000 | 0.000 | 0.243 | 0.000 | 0.618 | 0.139 | ||
| 1 spectrum, CSVASIK | 0.020 | 0.000 | 0.000 | 0.058 | 0.160 | 0.000 | 0.587 | 0.175 |
| Plot | Mito | Lyso or Perox | ER | Golgi | PM | Cytosol | Nucleus | ||||||
| Expt B |
5 peptides |
14 spectra |
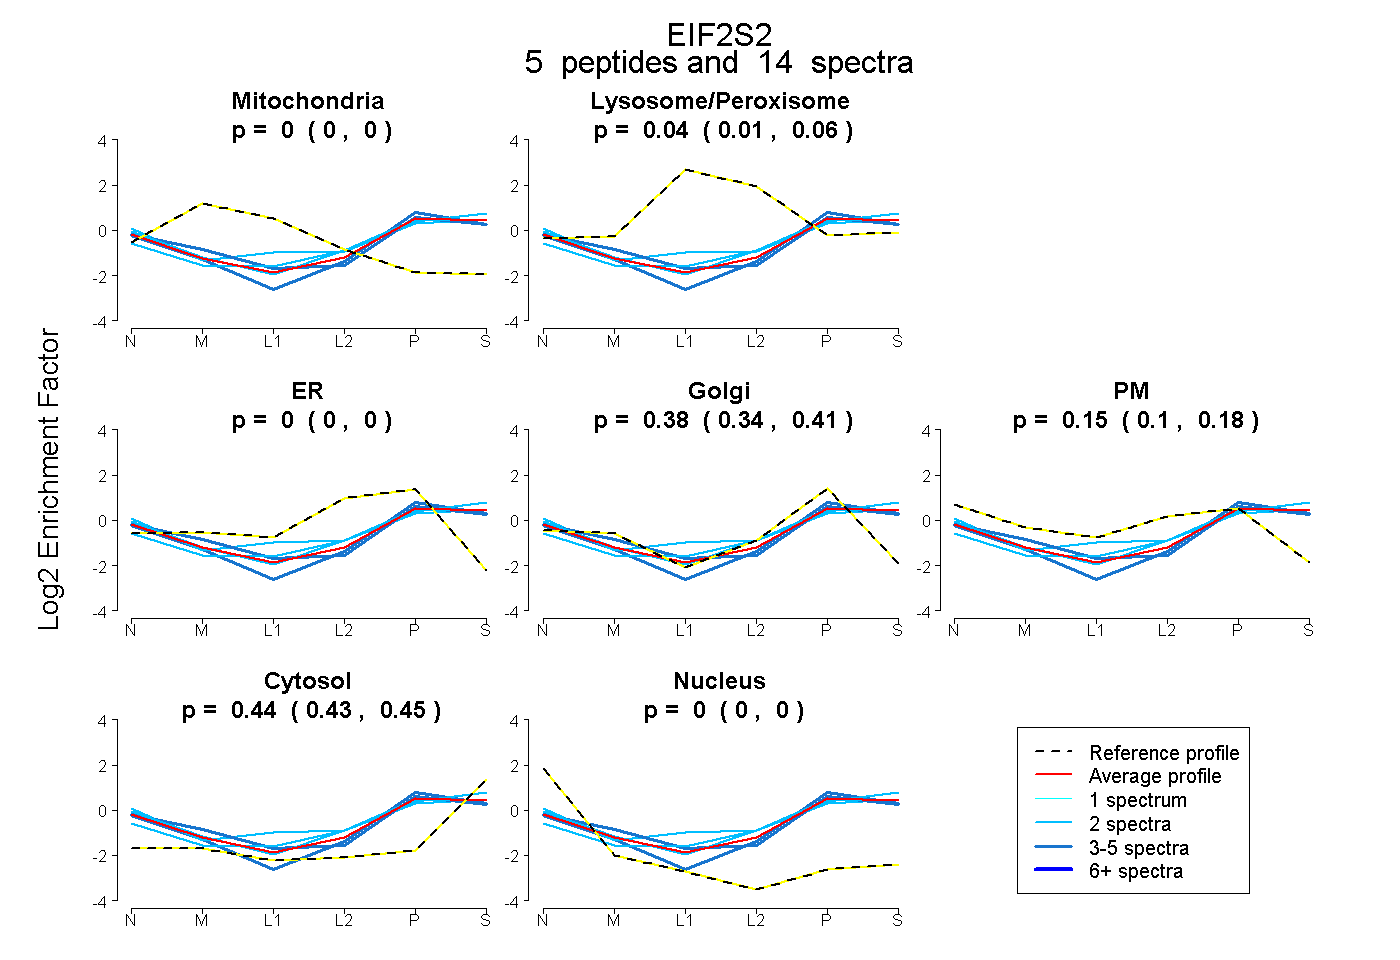 |
0.000 0.000 | 0.000 |
0.036 0.007 | 0.060 |
0.000 0.000 | 0.000 |
0.378 0.343 | 0.406 |
0.146 0.101 | 0.184 |
0.441 0.428 | 0.452 |
0.000 0.000 | 0.000 |
|||
| Plot | Lyso | Other | |||||||||||
| Expt C |
10 peptides |
31 spectra |
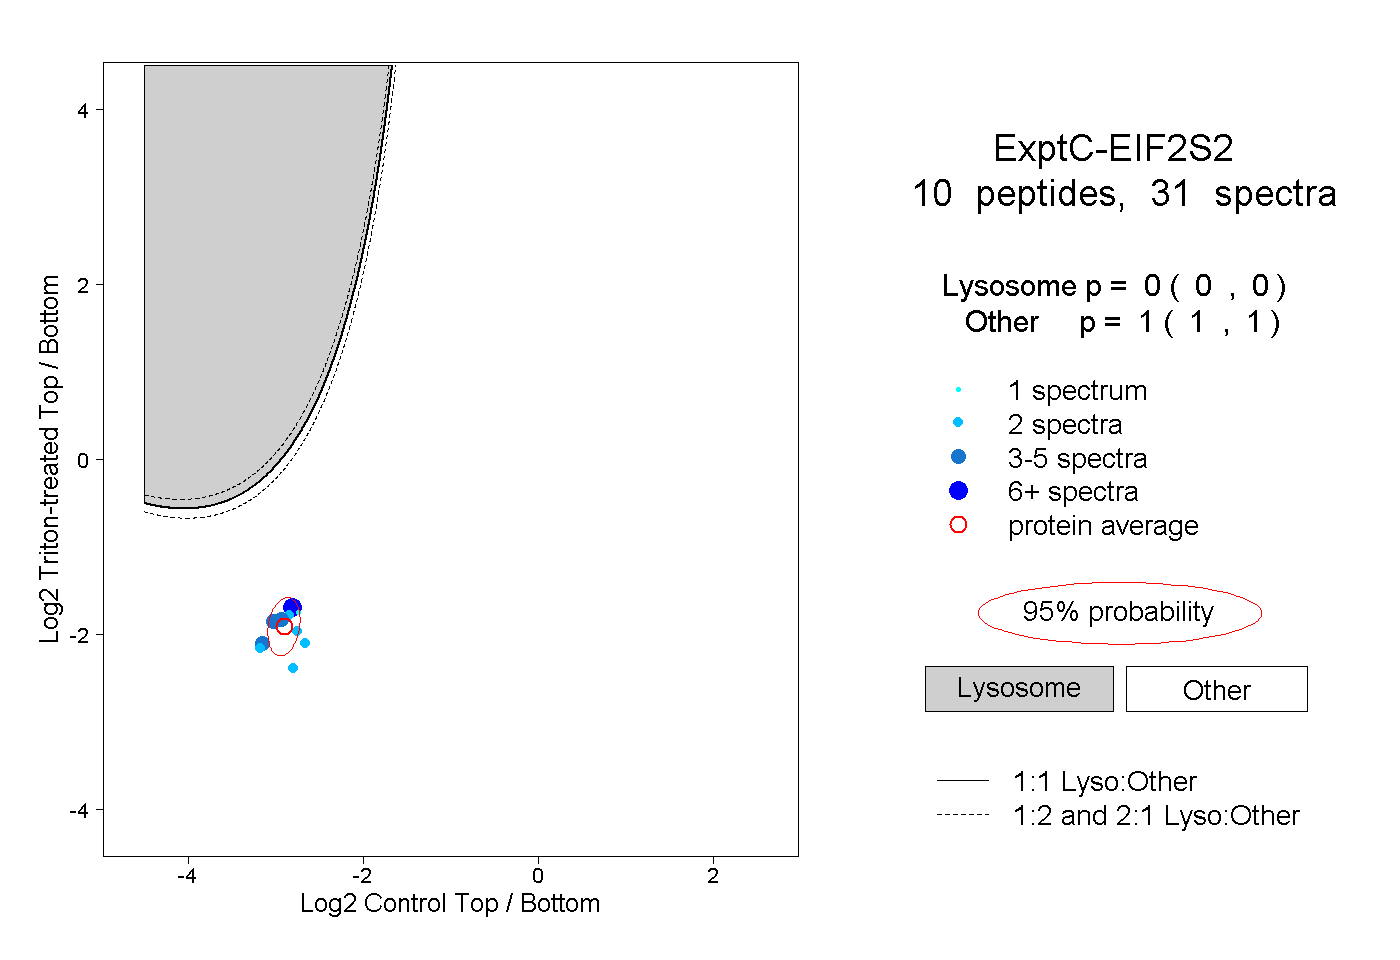 |
0.000 0.000 | 0.000 |
1.000 1.000 | 1.000 |
||||||||
| Plot | Lyso | Other | |||||||||||
| Expt D |
3 peptides |
5 spectra |
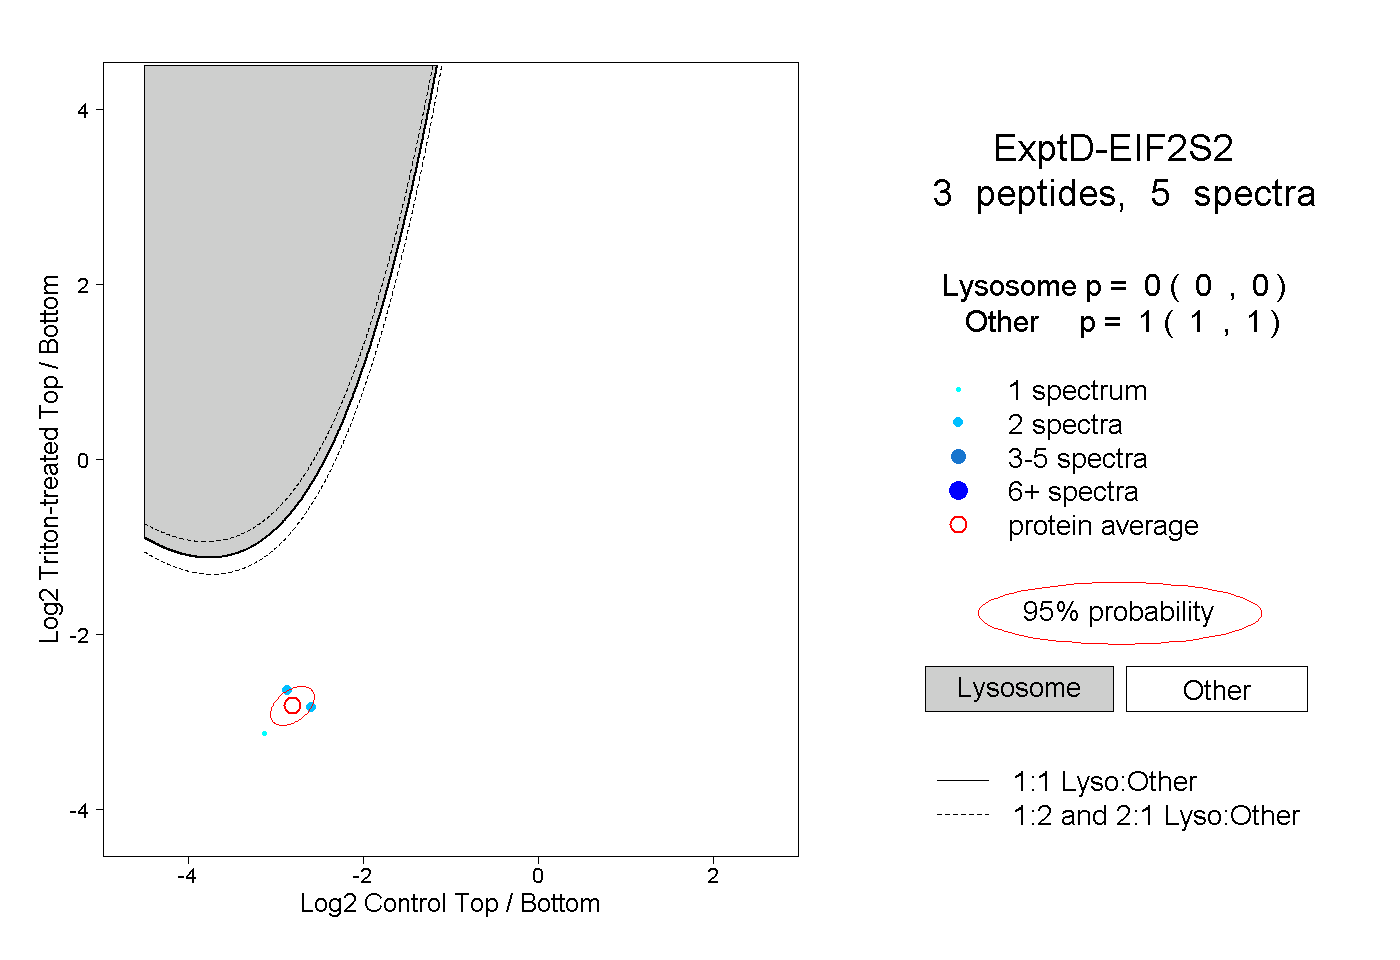 |
0.000 0.000 | 0.000 |
1.000 1.000 | 1.000 |