 2
2peptides
spectra
0.000 | 0.144
0.000 | 0.041
0.000 | 0.116
0.000 | 0.368
0.000 | 0.209
0.257 | 0.706
0.000 | 0.319
0.000 | 0.124
1peptide
spectra
0.000 | 0.000
1.000 | 1.000
| Plot | Mito | Lyso | Perox | ER | Golgi | PM | Cytosol | Nucleus | |||||
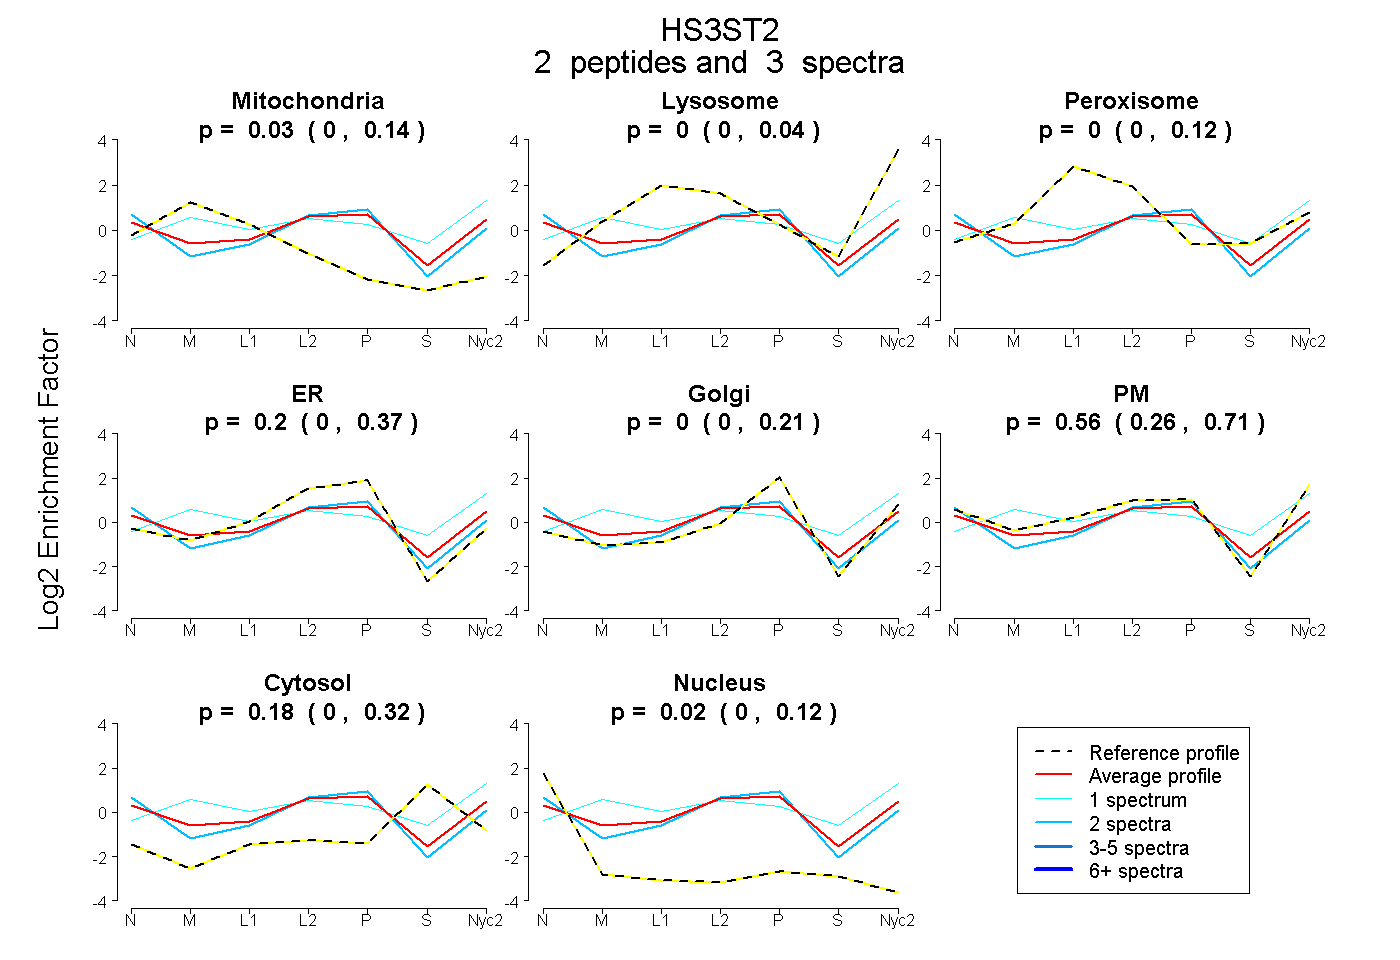
| Expt A |
2 peptides |
3 spectra |
|
0.034 0.000 | 0.144 |
0.000 0.000 | 0.041 |
0.000 0.000 | 0.116 |
0.203 0.000 | 0.368 |
0.000 0.000 | 0.209 |
0.561 0.257 | 0.706 |
0.180 0.000 | 0.319 |
0.023 0.000 | 0.124 |
||
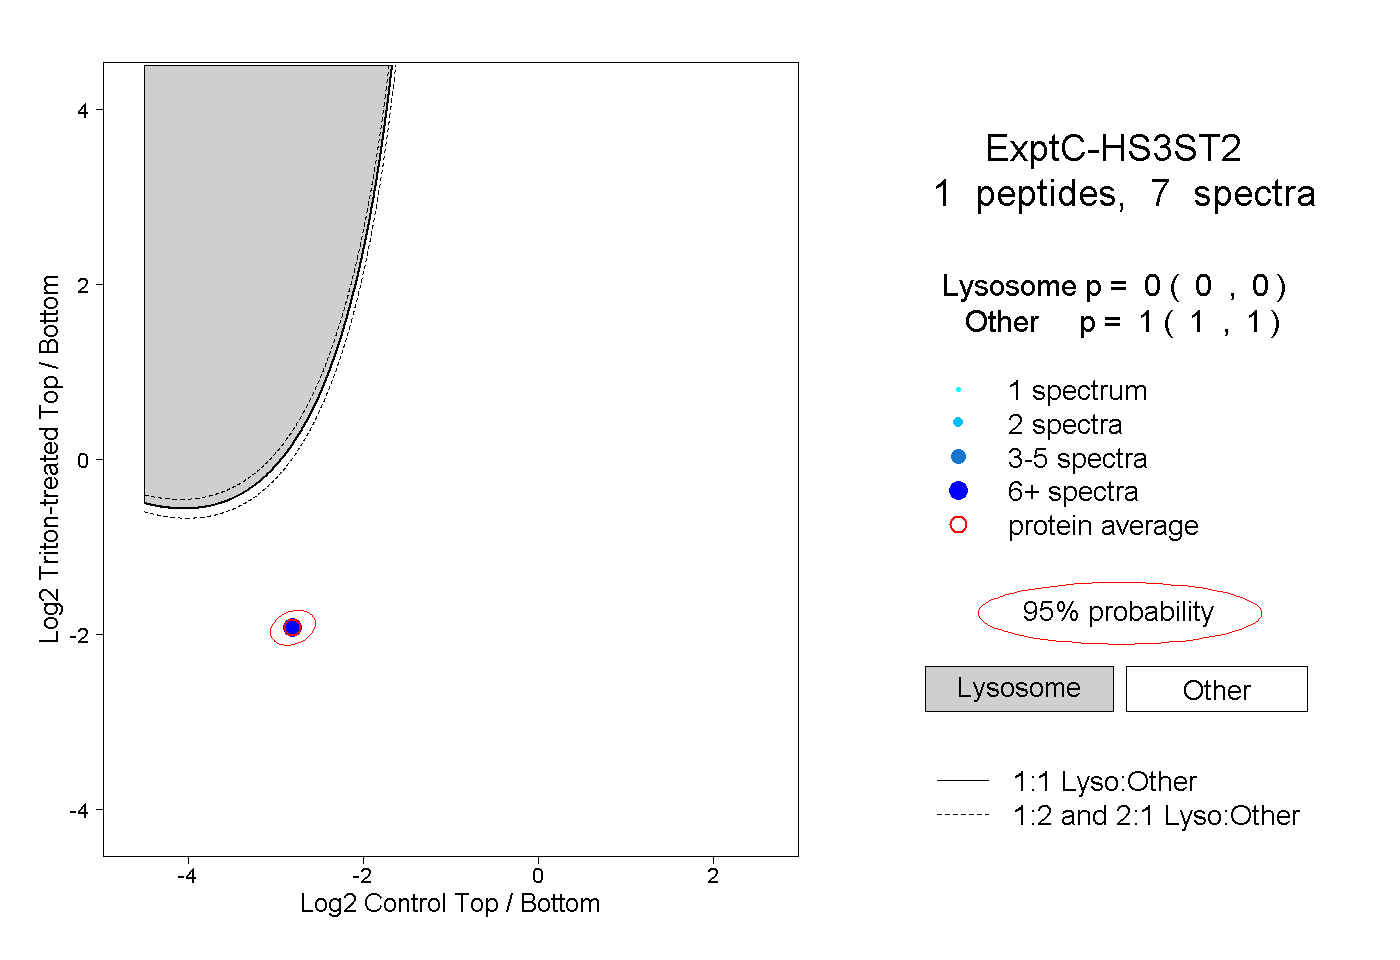
| Plot | Lyso | Other | |||||||||||
| Expt C |
1 peptide |
7 spectra |
|
0.000 0.000 | 0.000 |
1.000 1.000 | 1.000 |