 6
6peptides
spectra
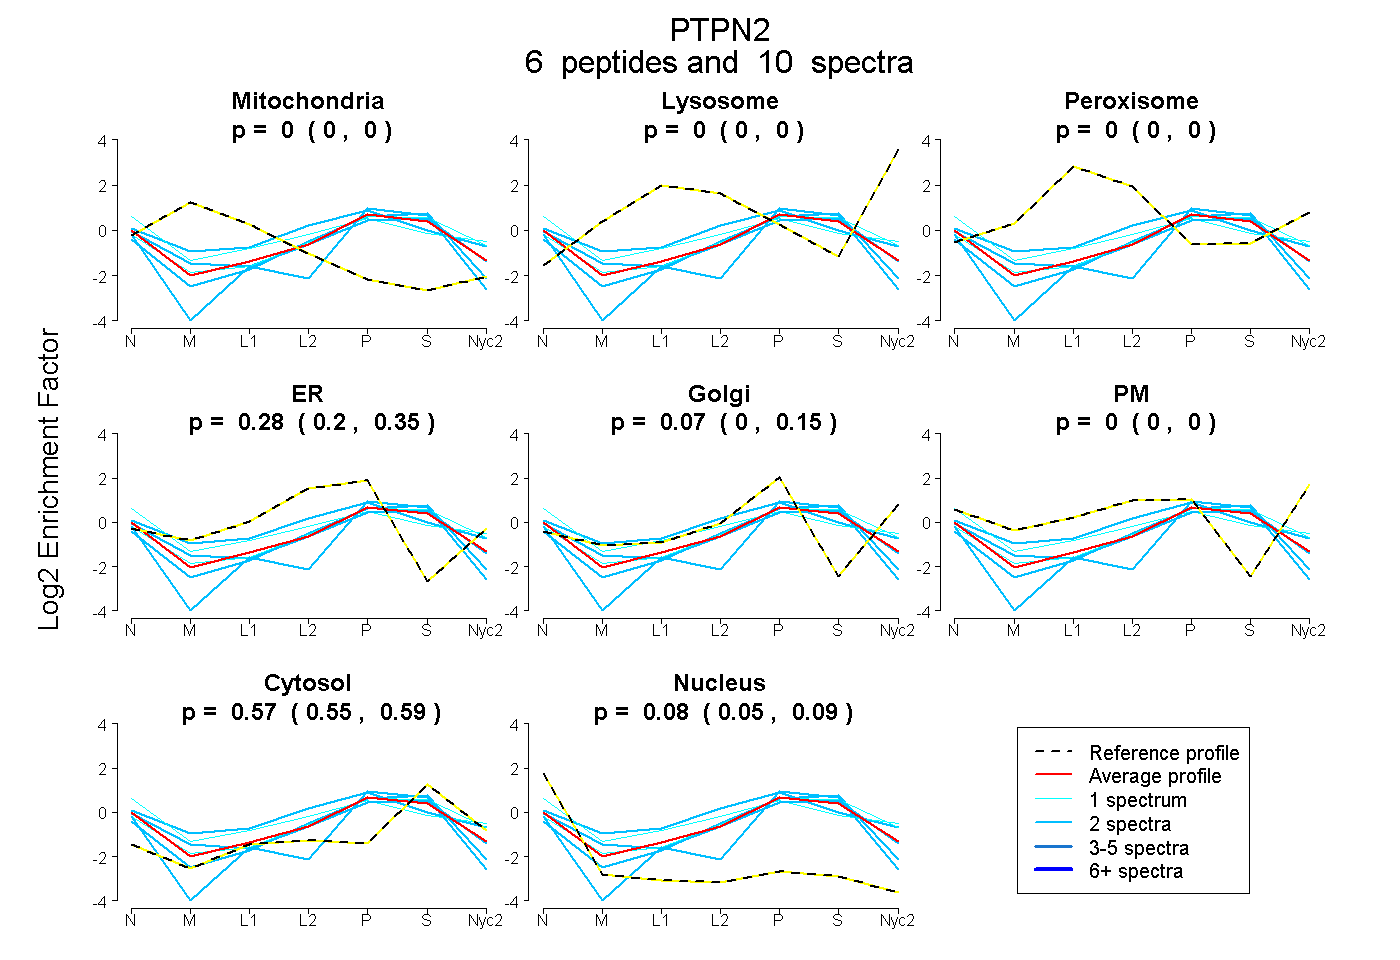
0.000 | 0.000
0.000 | 0.000
0.000 | 0.000
0.197 | 0.345
0.000 | 0.147
0.000 | 0.000
0.553 | 0.591
0.053 | 0.095
1peptide
spectra
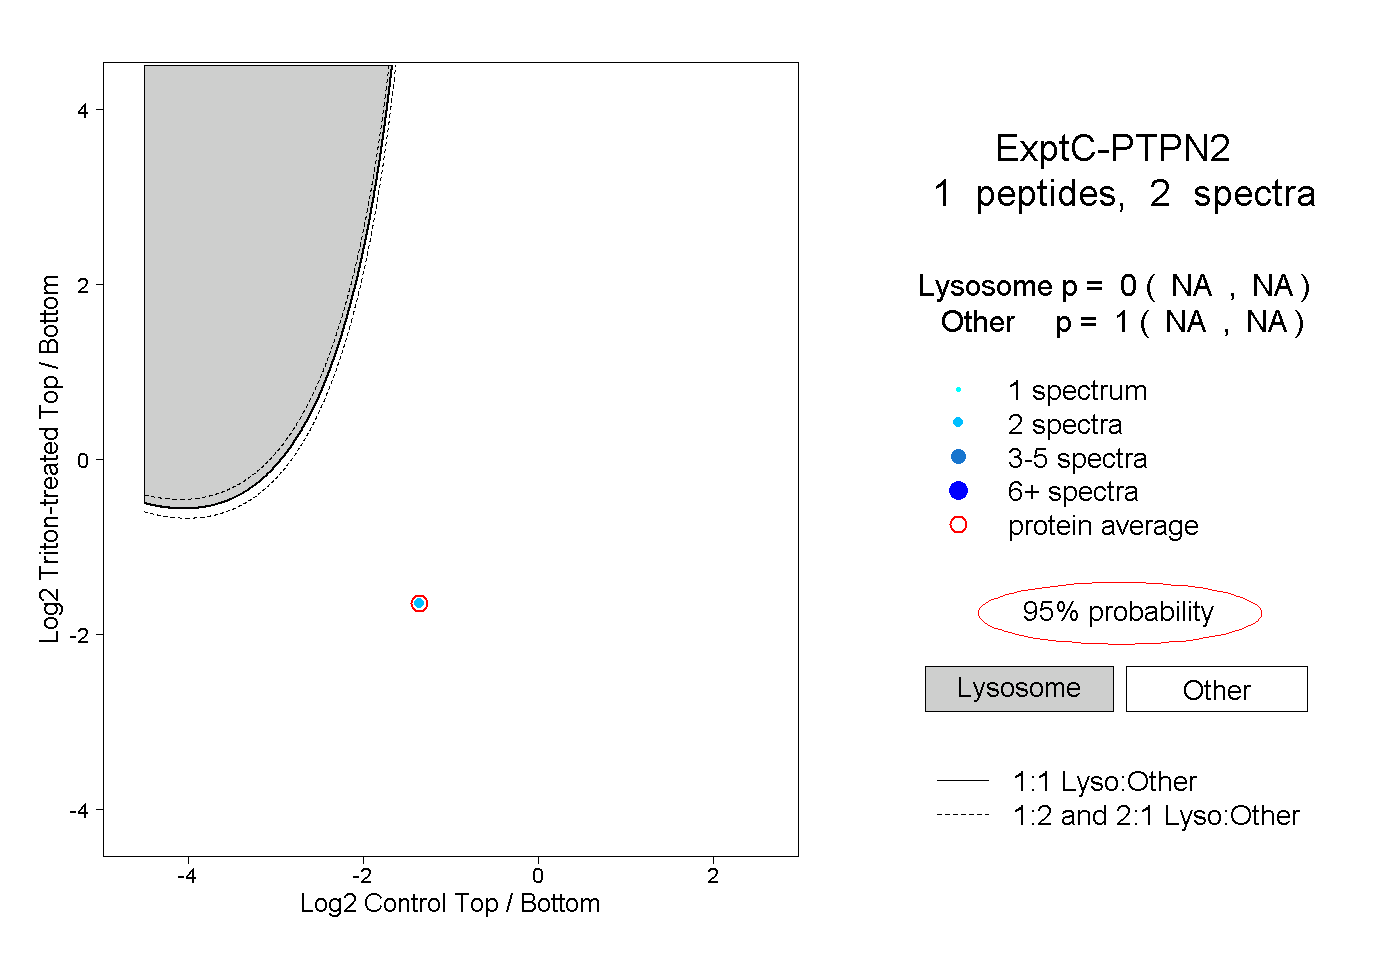
NA | NA
NA | NA
1peptide
spectrum
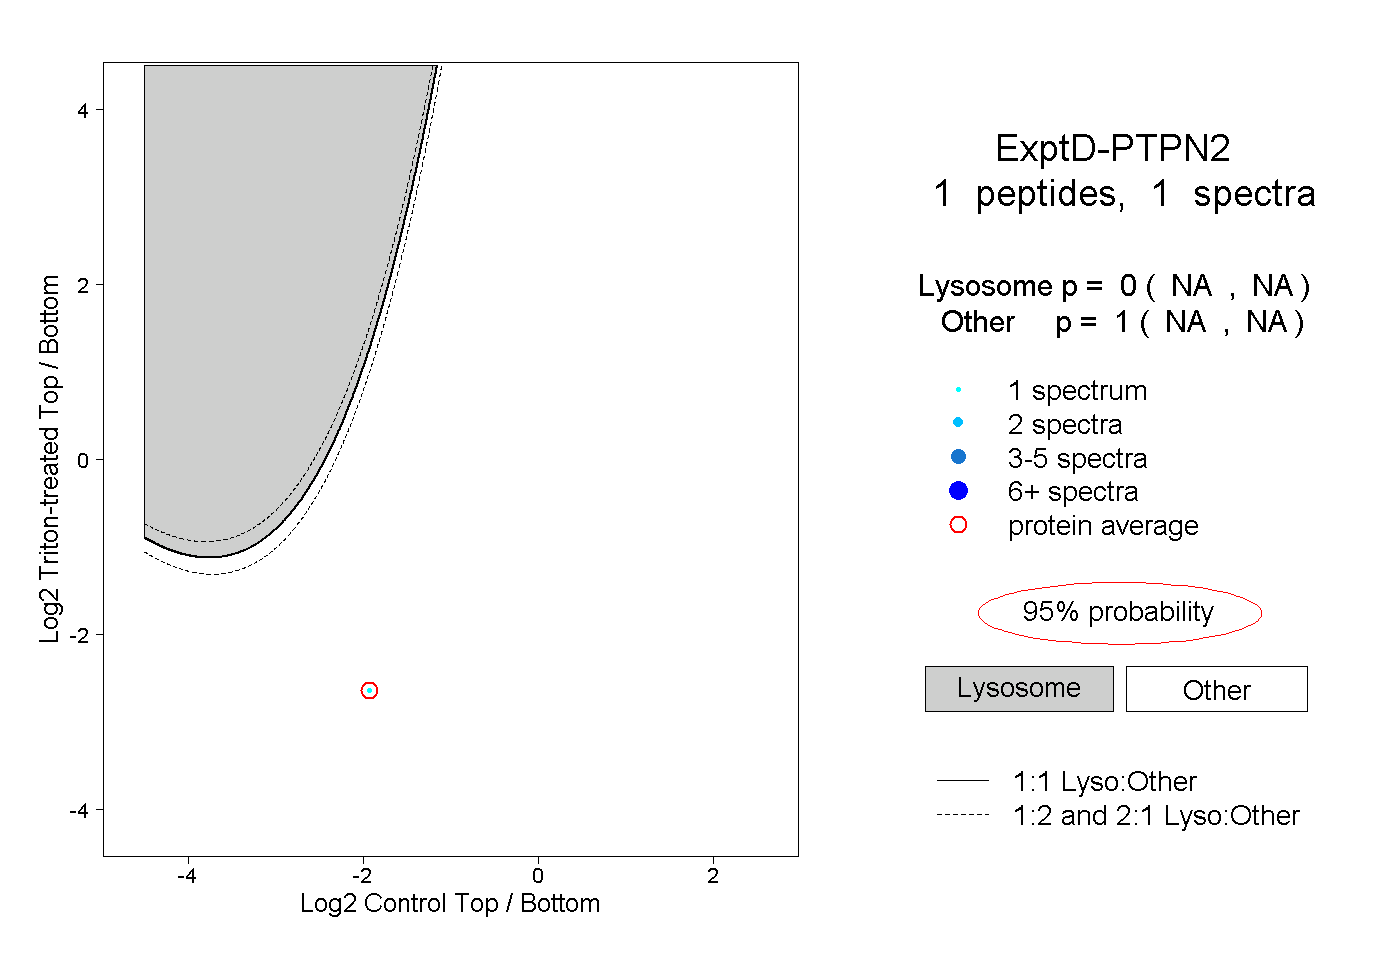
NA | NA
NA | NA