 2
2peptides
spectra
0.000 | 0.015
0.000 | 0.000
0.000 | 0.091
0.000 | 0.110
0.006 | 0.237
0.371 | 0.523
0.273 | 0.342
0.000 | 0.000
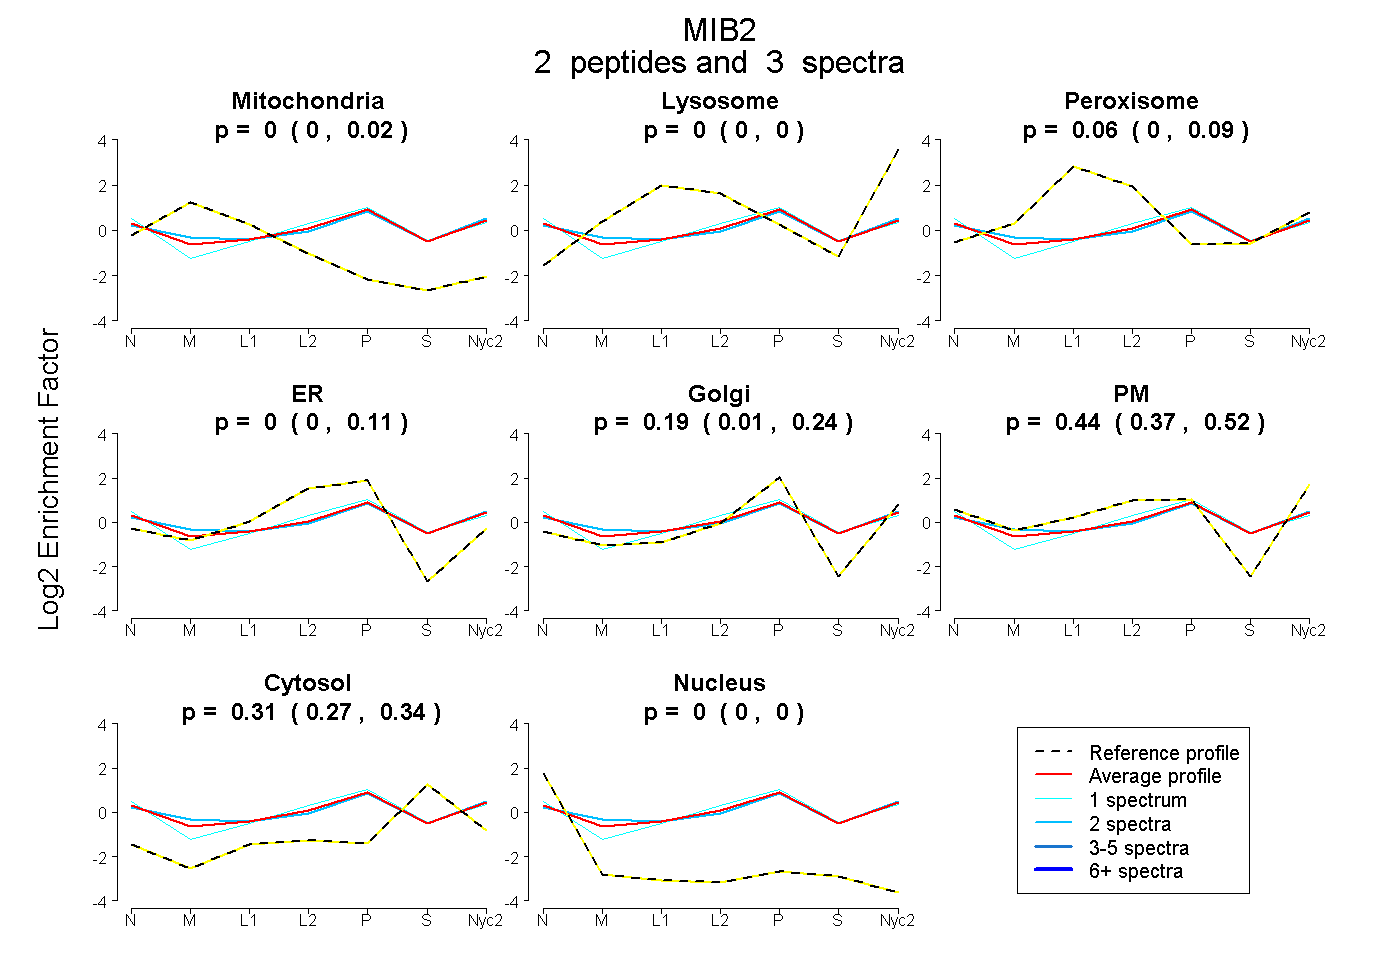
| Plot | Mito | Lyso | Perox | ER | Golgi | PM | Cytosol | Nucleus | |||||
| Expt A |
2 peptides |
3 spectra |
|
0.000 0.000 | 0.015 |
0.000 0.000 | 0.000 |
0.065 0.000 | 0.091 |
0.000 0.000 | 0.110 |
0.188 0.006 | 0.237 |
0.439 0.371 | 0.523 |
0.308 0.273 | 0.342 |
0.000 0.000 | 0.000 |
| 1 spectrum, HDLTHAFER | 0.000 | 0.000 | 0.000 | 0.164 | 0.042 | 0.449 | 0.345 | 0.000 | ||
| 2 spectra, GHVLAVR | 0.017 | 0.000 | 0.087 | 0.000 | 0.203 | 0.406 | 0.287 | 0.000 |