18
18peptides
spectra
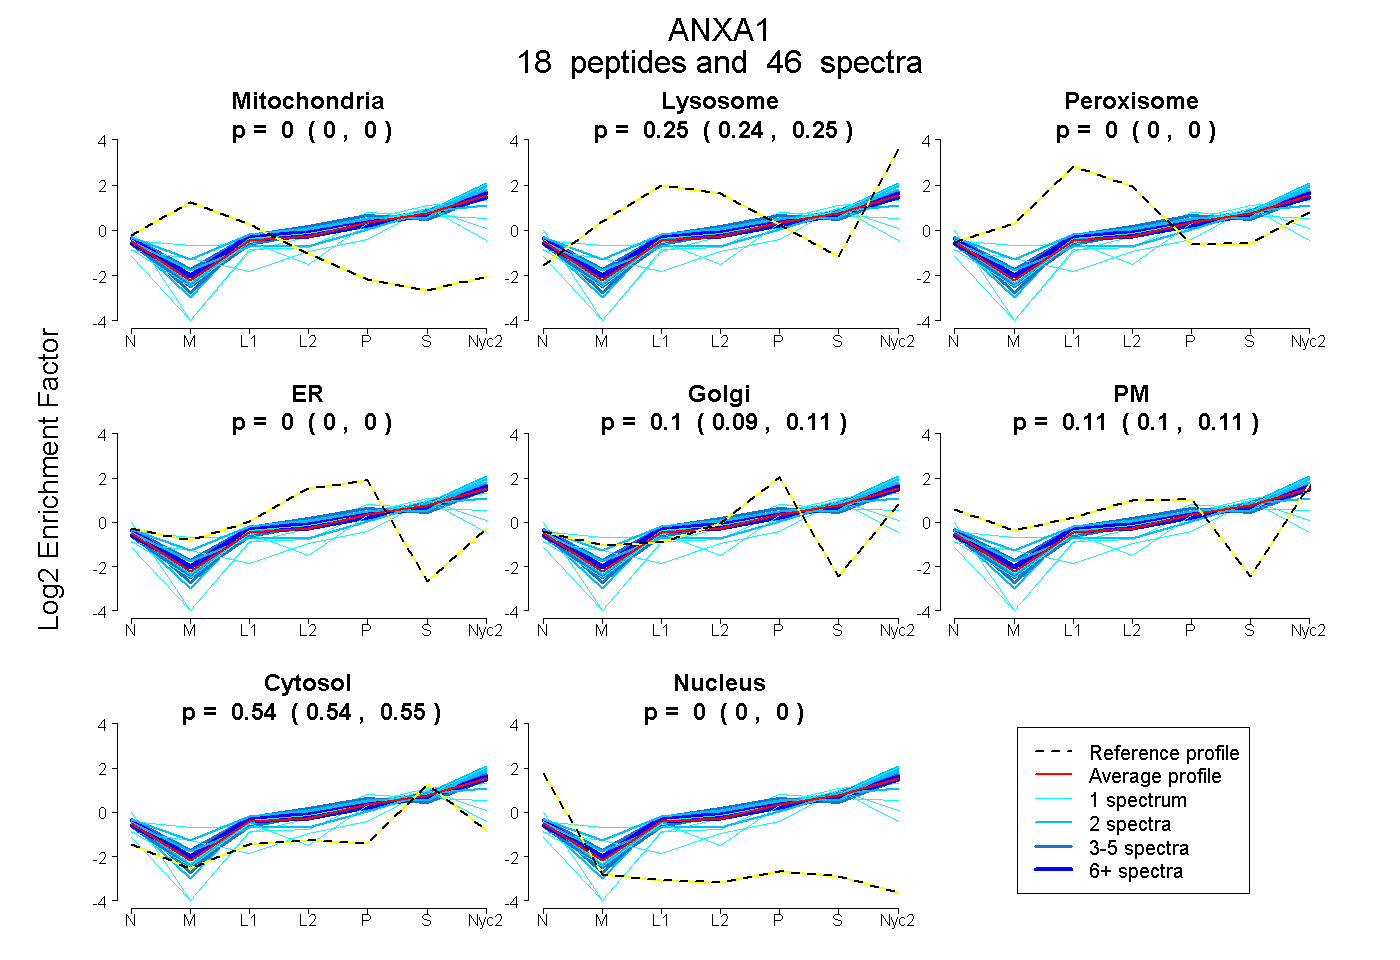
0.000 | 0.000
0.243 | 0.253
0.000 | 0.000
0.000 | 0.000
0.094 | 0.110
0.097 | 0.114
0.539 | 0.545
0.000 | 0.000
7peptides
spectra
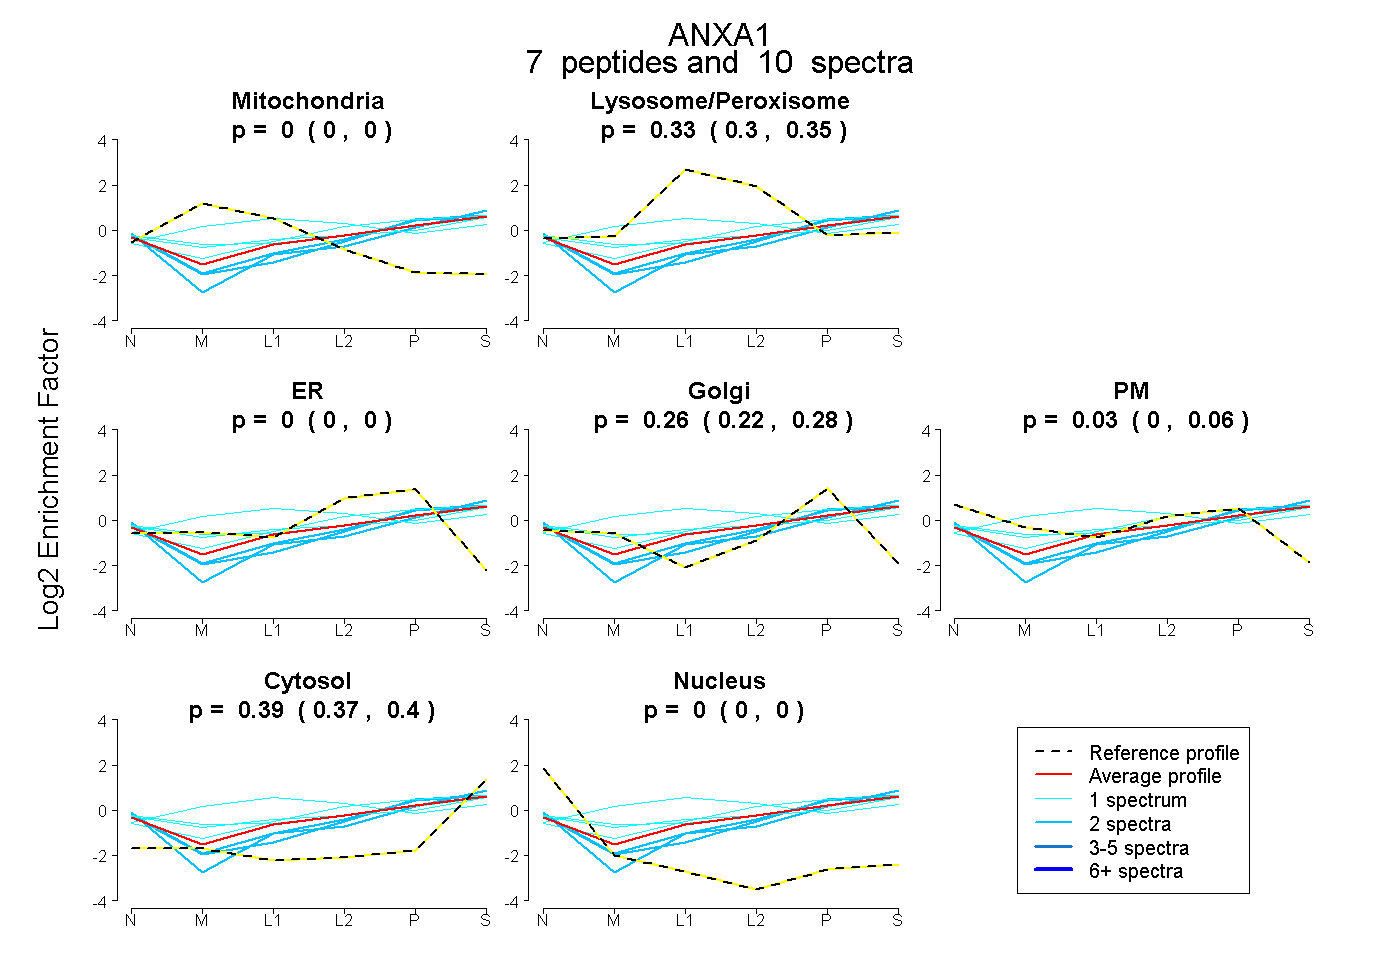
0.000 | 0.000
0.302 | 0.353
0.000 | 0.000
0.222 | 0.281
0.000 | 0.061
0.369 | 0.402
0.000 | 0.000