 7
7peptides
spectra
0.000 | 0.000
0.000 | 0.036
0.000 | 0.047
0.000 | 0.000
0.003 | 0.125
0.051 | 0.203
0.739 | 0.781
0.000 | 0.000
2peptides
spectra
NA | NA
NA | NA
NA | NA
NA | NA
NA | NA
NA | NA
NA | NA
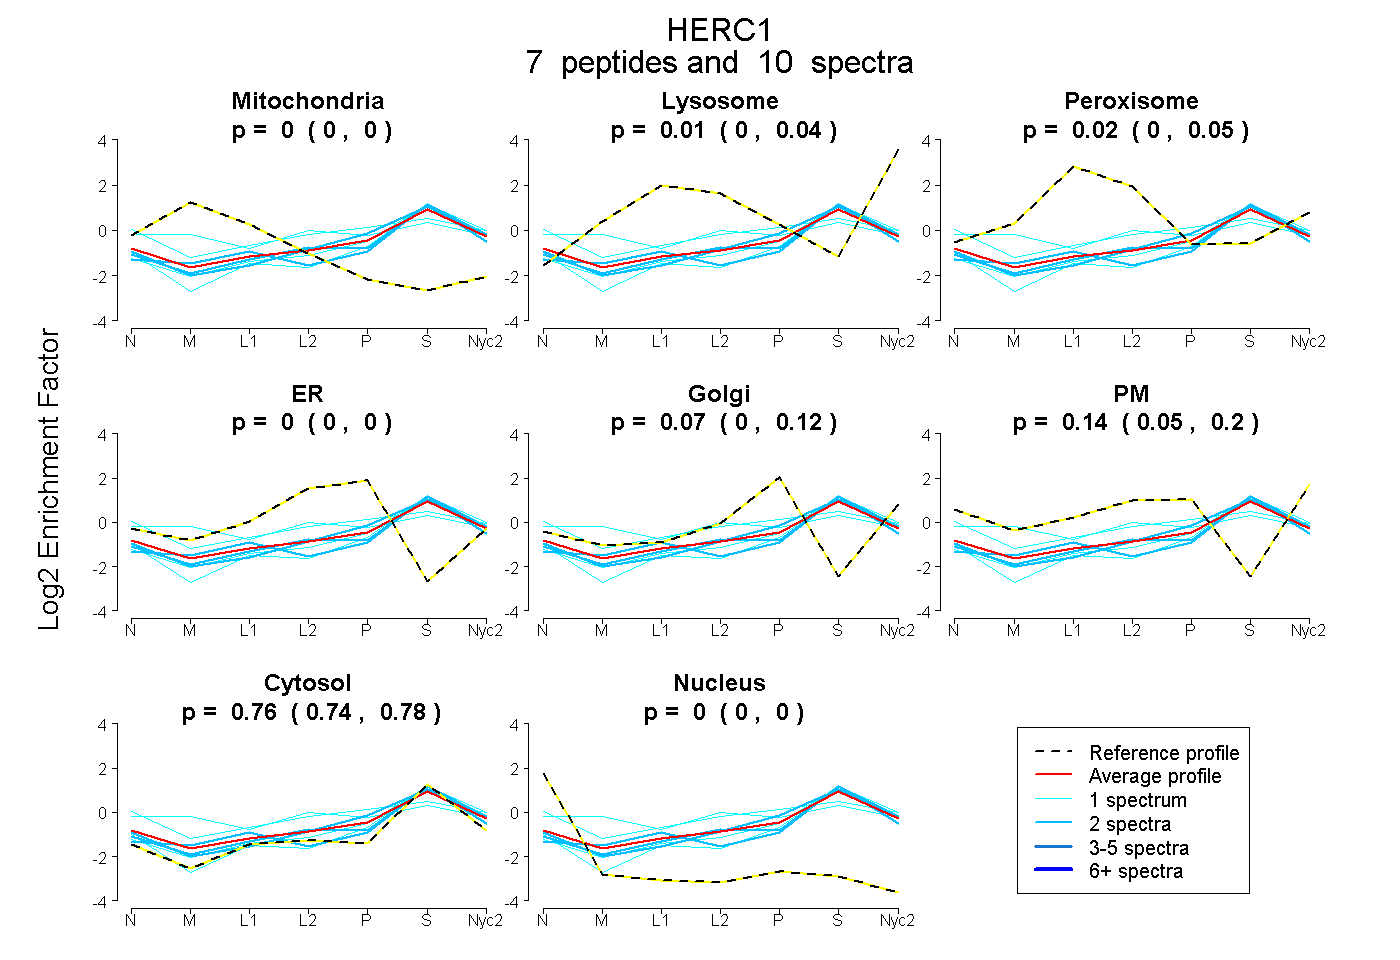
| Plot | Mito | Lyso | Perox | ER | Golgi | PM | Cytosol | Nucleus | |||||
| Expt A |
7 peptides |
10 spectra |
|
0.000 0.000 | 0.000 |
0.010 0.000 | 0.036 |
0.021 0.000 | 0.047 |
0.000 0.000 | 0.000 |
0.069 0.003 | 0.125 |
0.137 0.051 | 0.203 |
0.762 0.739 | 0.781 |
0.000 0.000 | 0.000 |
||
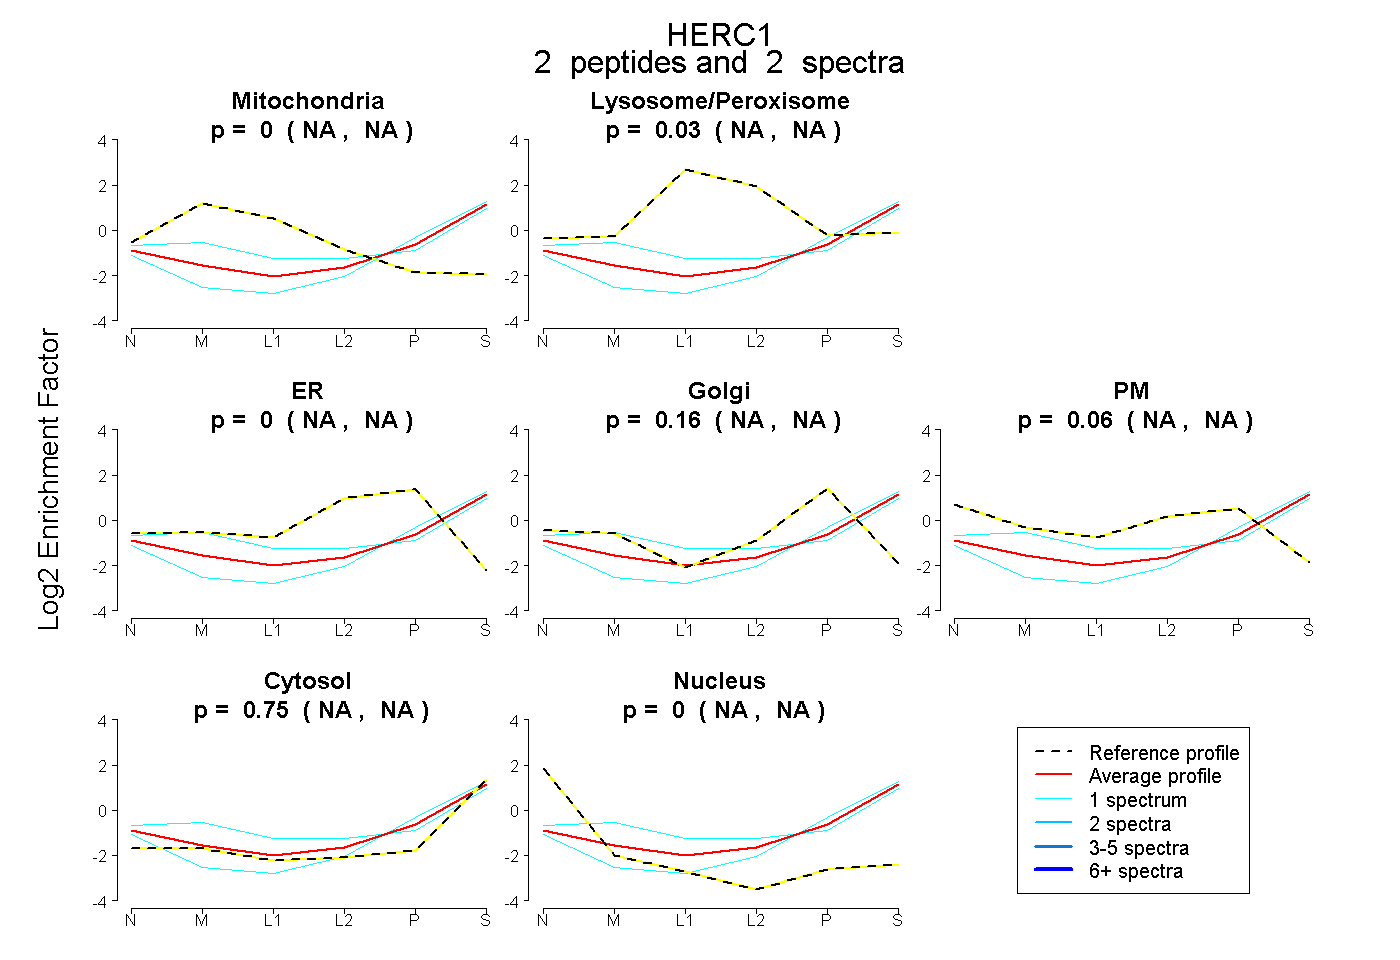
| Plot | Mito | Lyso or Perox | ER | Golgi | PM | Cytosol | Nucleus | ||||||
| Expt B |
2 peptides |
2 spectra |
|
0.000 NA | NA |
0.027 NA | NA |
0.000 NA | NA |
0.163 NA | NA |
0.063 NA | NA |
0.747 NA | NA |
0.000 NA | NA |