CLCN7
[ENSRNOP00000023615]
Main page
| | | Plot |
Mito |
Lyso |
|
Perox |
ER |
Golgi |
PM |
Cytosol |
Nucleus |
|
| Expt A |
 14
14
peptides |
43
spectra |
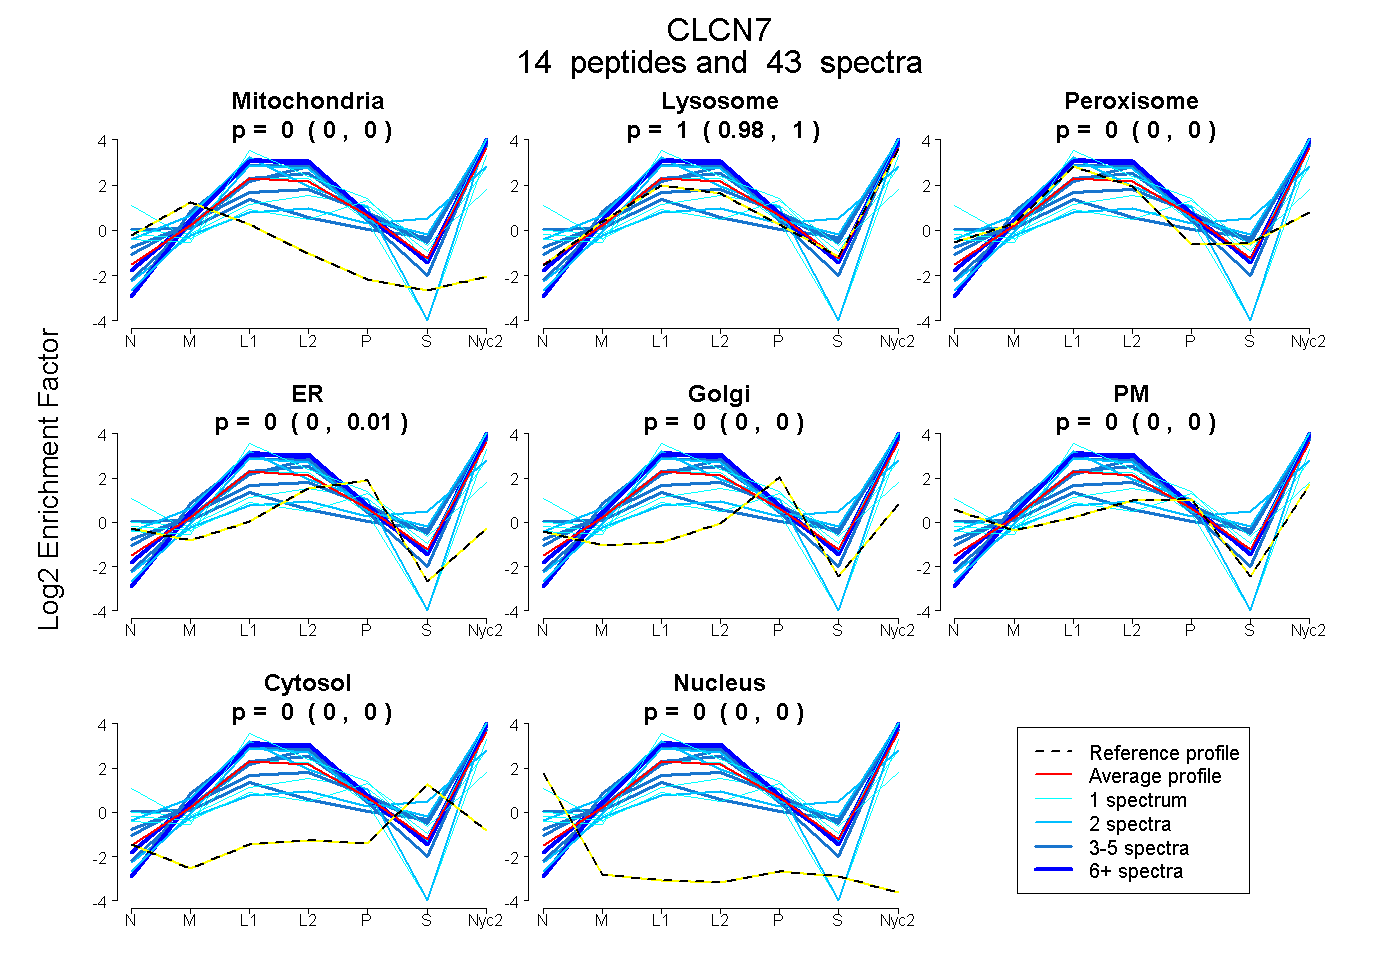 |
0.000
0.000 | 0.000 |
0.997
0.985 | 1.000 |
|
0.000
0.000 | 0.002 |
0.003
0.000 | 0.012 |
0.000
0.000 | 0.000 |
0.000
0.000 | 0.000 |
0.000
0.000 | 0.000 |
0.000
0.000 | 0.000 |
|
| | | Plot |
Mito |
|
Lyso or Perox |
|
ER |
Golgi |
PM |
Cytosol |
Nucleus |
|
| Expt B |
8
peptides |
15
spectra |
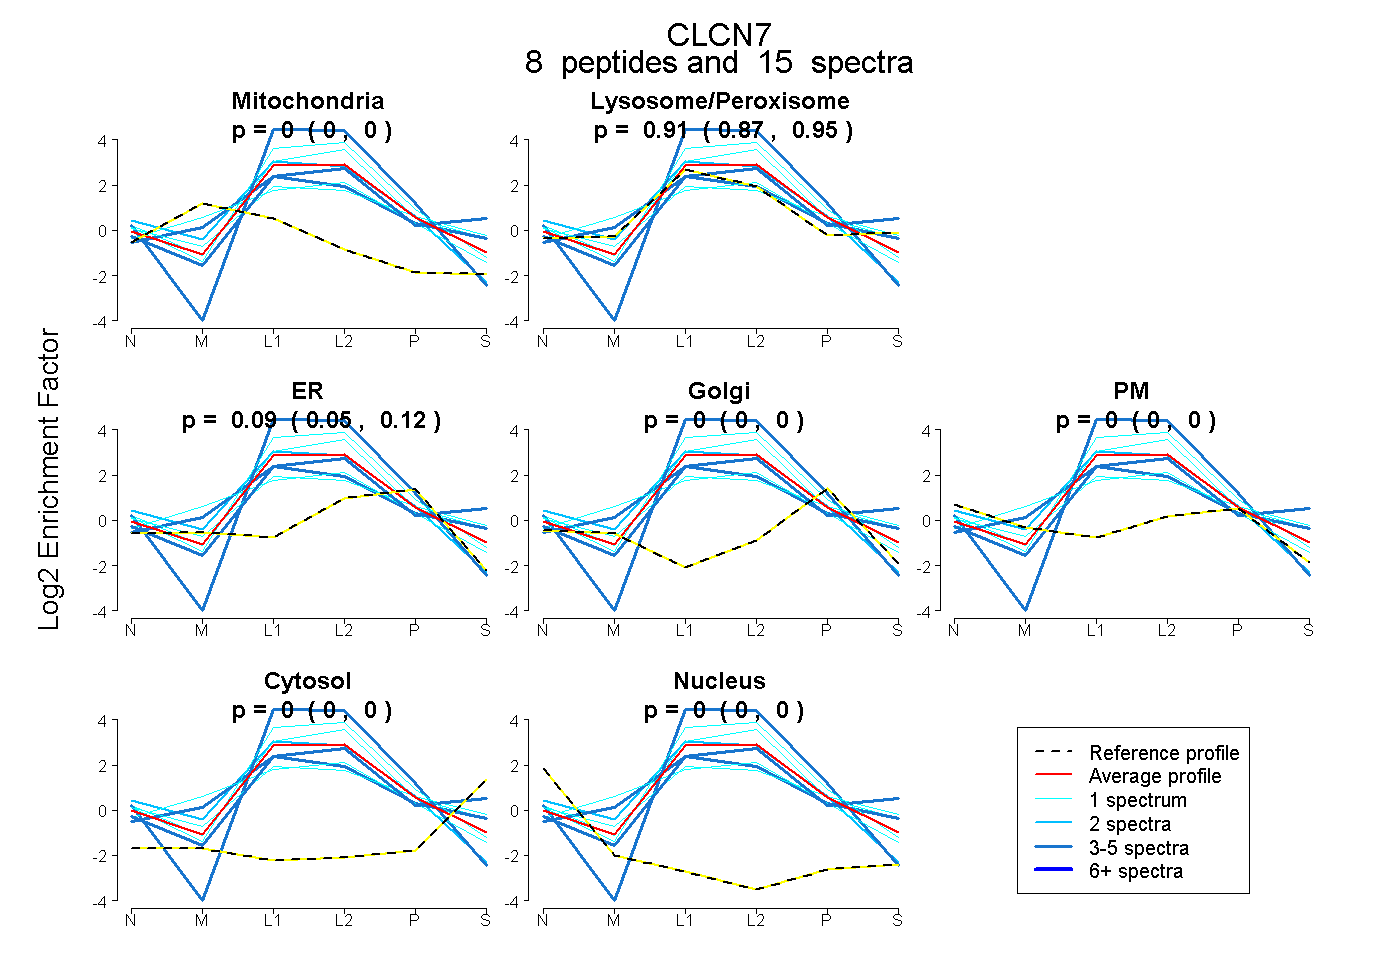 |
0.000
0.000 | 0.000 |
|
0.913
0.874 | 0.946 |
|
0.087
0.047 | 0.121 |
0.000
0.000 | 0.000 |
0.000
0.000 | 0.000 |
0.000
0.000 | 0.000 |
0.000
0.000 | 0.000 |
|
| 3 spectra, SNMGLVQR |
0.000 |
|
0.994 |
|
0.000 |
0.000 |
0.000 |
0.006 |
0.000 |
|
| 1 spectrum, IPHVVR |
0.000 |
|
0.774 |
|
0.149 |
0.000 |
0.077 |
0.000 |
0.000 |
|
| 1 spectrum, SQLIVLLK |
0.000 |
|
1.000 |
|
0.000 |
0.000 |
0.000 |
0.000 |
0.000 |
|
| 3 spectra, IFEYFR |
0.000 |
|
1.000 |
|
0.000 |
0.000 |
0.000 |
0.000 |
0.000 |
|
| 1 spectrum, EVMSTPVTCLR |
0.000 |
|
1.000 |
|
0.000 |
0.000 |
0.000 |
0.000 |
0.000 |
|
| 2 spectra, EIPHNEK |
0.000 |
|
0.817 |
|
0.183 |
0.000 |
0.000 |
0.000 |
0.000 |
|
| 1 spectrum, QSHSALFR |
0.058 |
|
0.653 |
|
0.289 |
0.000 |
0.000 |
0.000 |
0.000 |
|
| 3 spectra, INHTAFR |
0.000 |
|
0.878 |
|
0.122 |
0.000 |
0.000 |
0.000 |
0.000 |
|
| | | Plot |
|
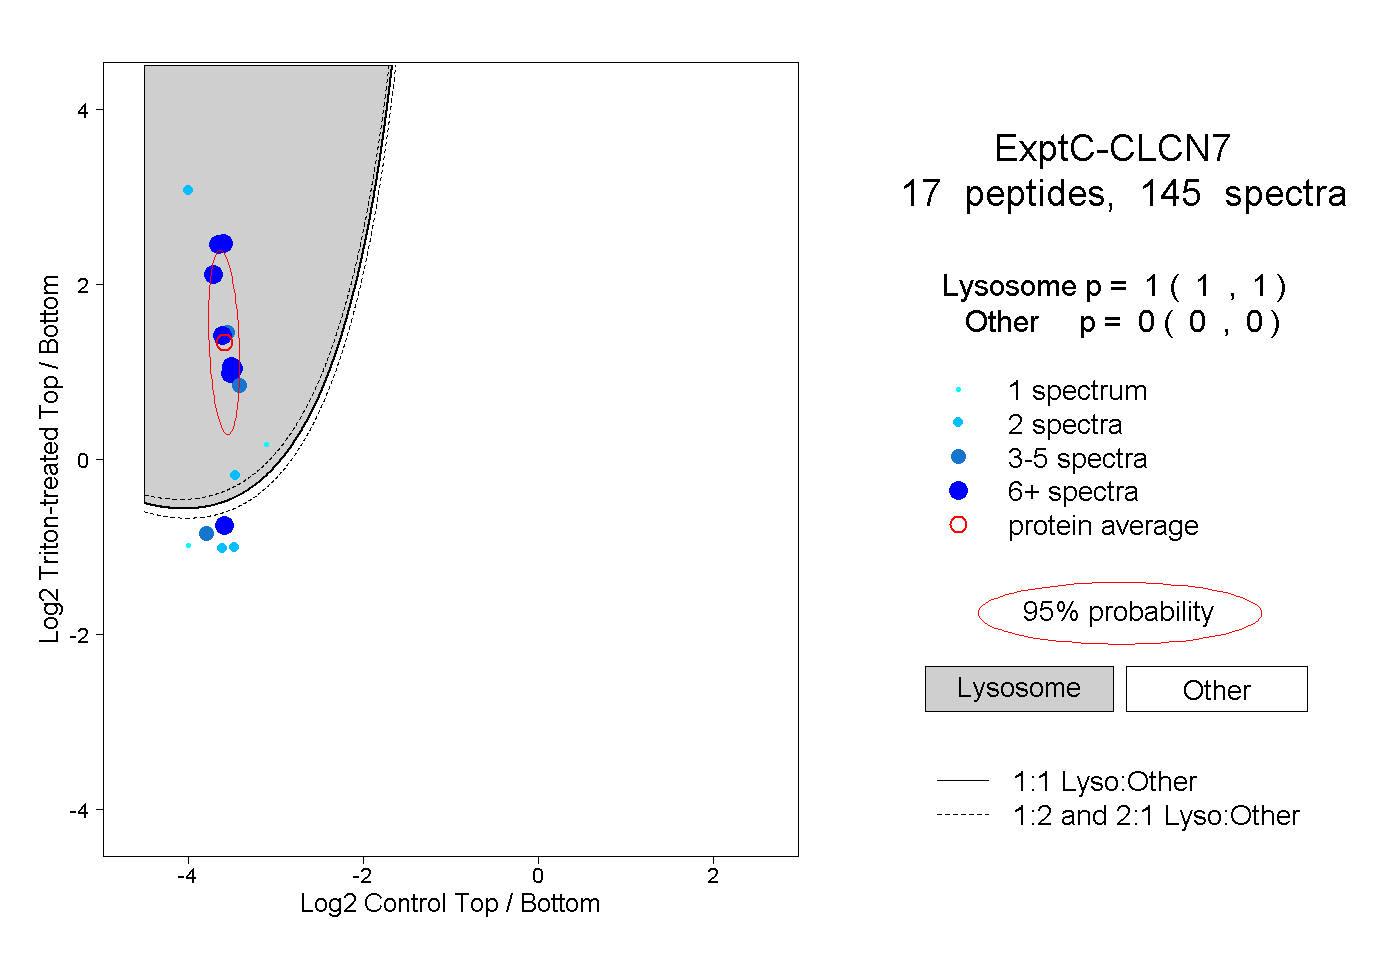
Lyso |
|
|
|
|
|
|
|
Other |
| Expt C |
17
peptides |
145
spectra |
 |
|
1.000
1.000 | 1.000 |
|
|
|
|
|
|
|
0.000
0.000 | 0.000 |
| | | Plot |
|
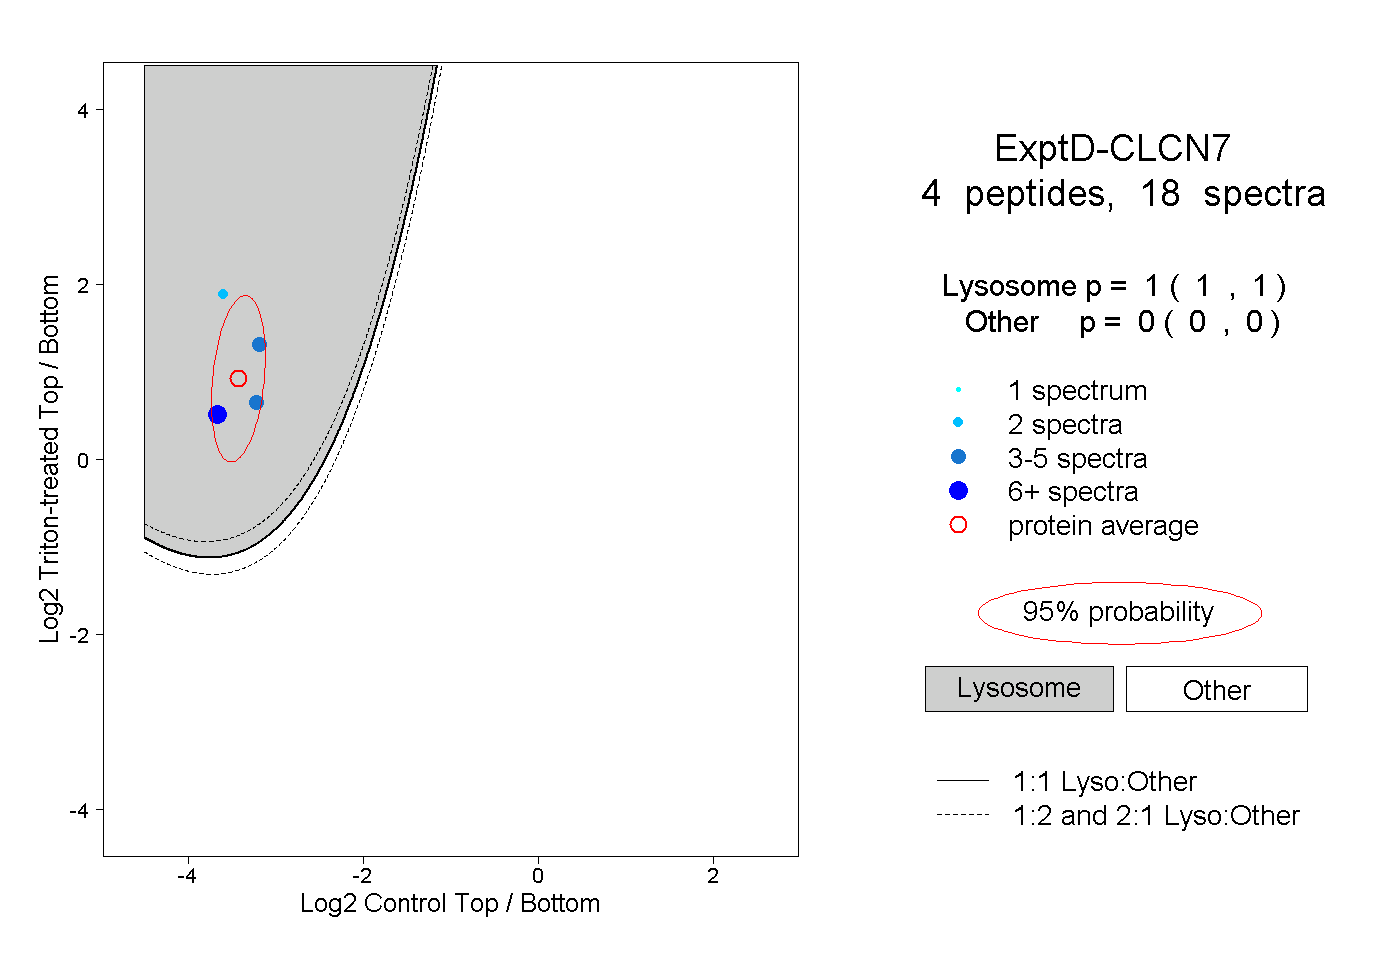
Lyso |
|
|
|
|
|
|
|
Other |
| Expt D |
4
peptides |
18
spectra |
 |
|
1.000
1.000 | 1.000 |
|
|
|
|
|
|
|
0.000
0.000 | 0.000 |