 1
1peptide
spectra
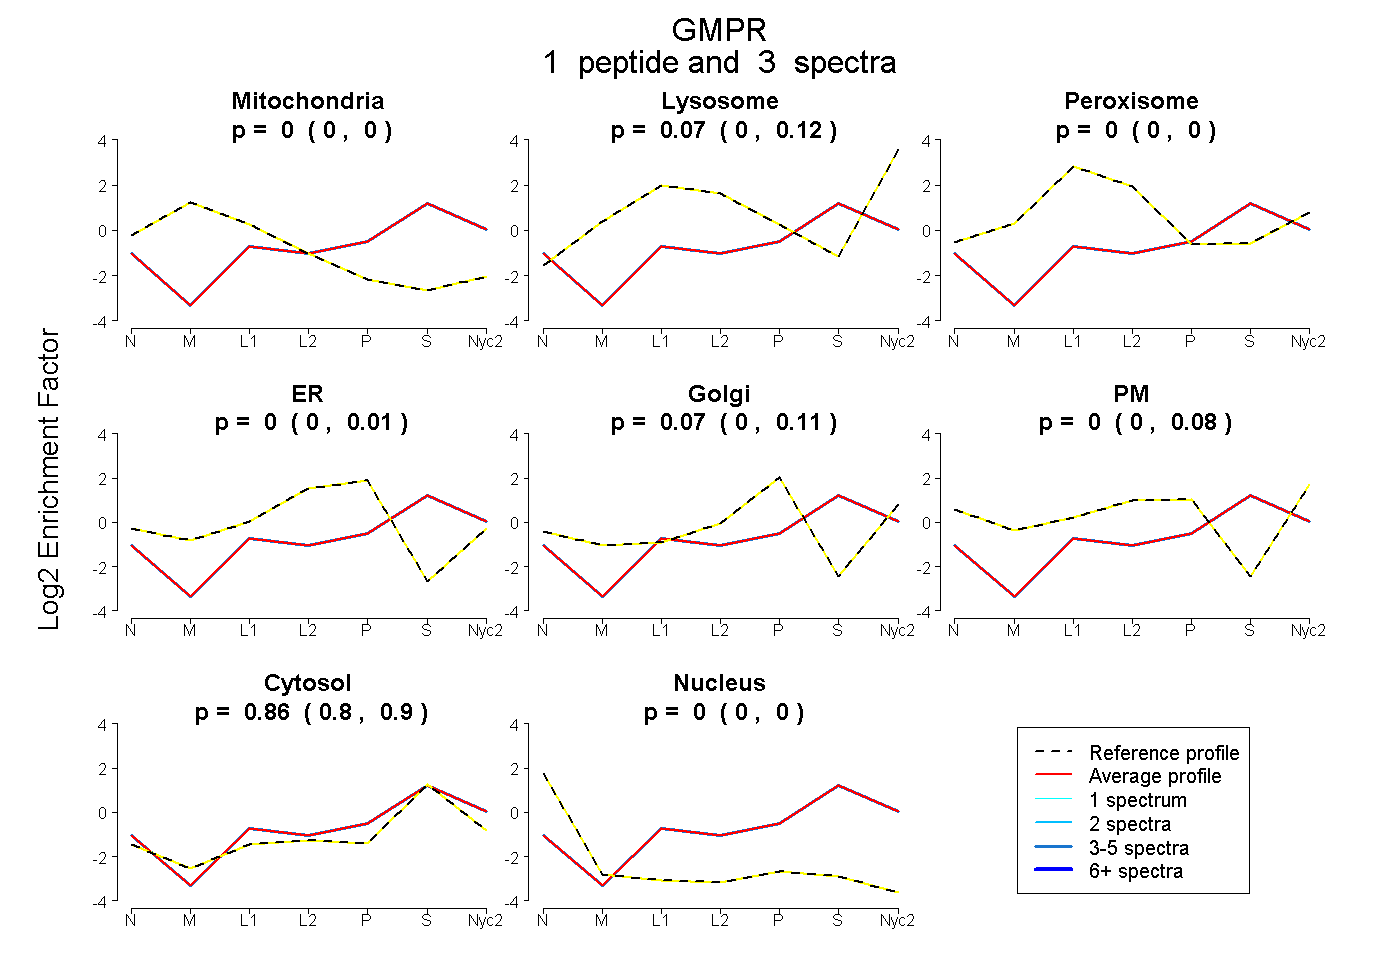
0.000 | 0.000
0.000 | 0.121
0.000 | 0.000
0.000 | 0.006
0.000 | 0.110
0.000 | 0.079
0.805 | 0.901
0.000 | 0.000
2peptides
spectra

1.000 | 1.000
0.000 | 0.000
1peptide
spectrum
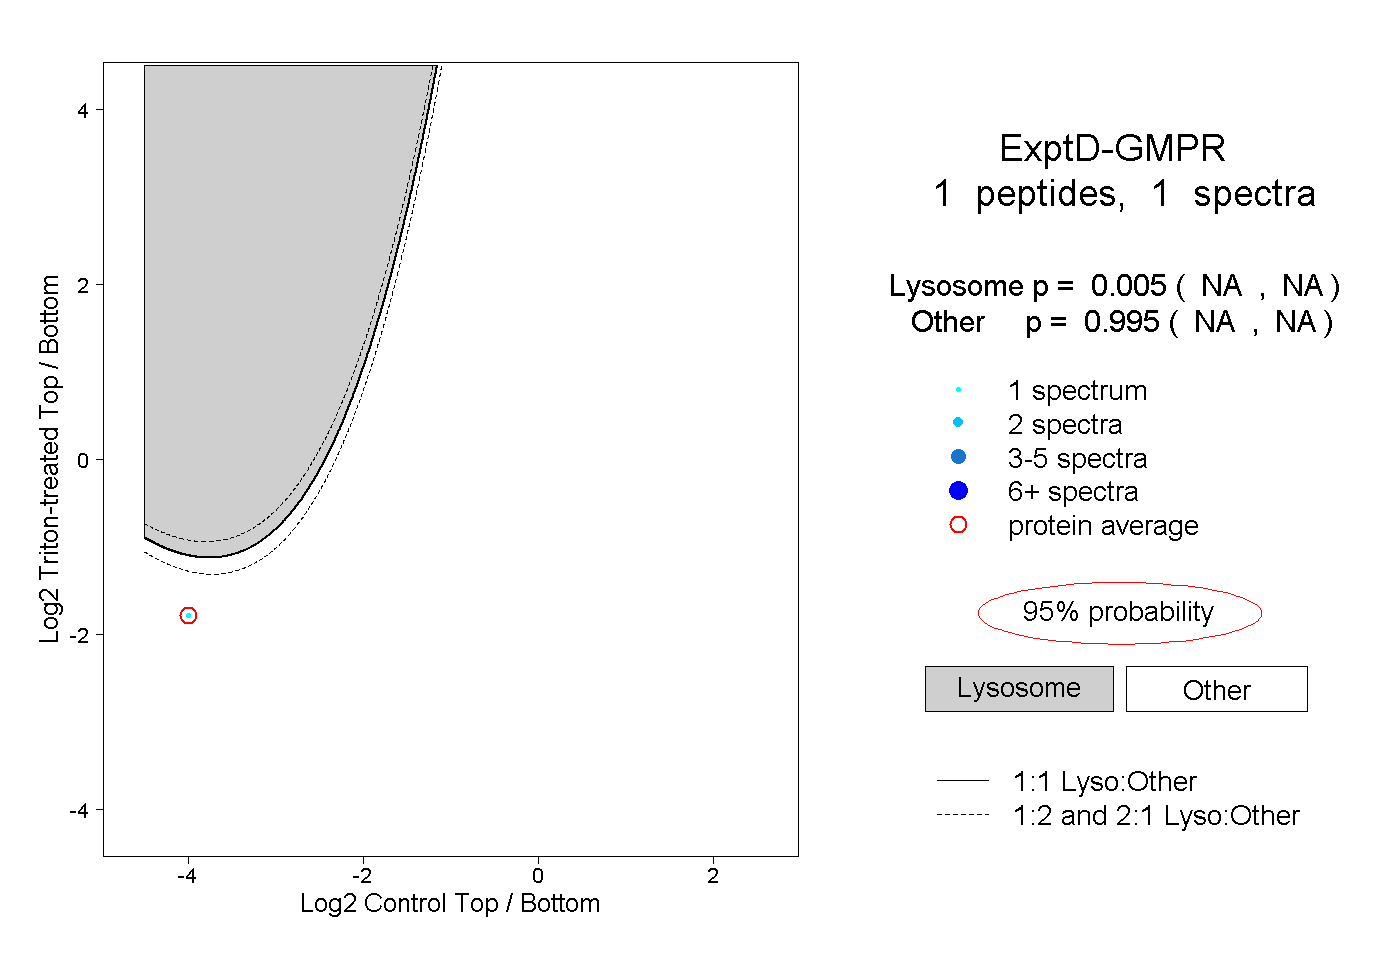
NA | NA
NA | NA