ATP6V0D1
[ENSRNOP00000023606]
Main page
| | | Plot |
Mito |
Lyso |
|
Perox |
ER |
Golgi |
PM |
Cytosol |
Nucleus |
|
| Expt A |
 10
10
peptides |
60
spectra |
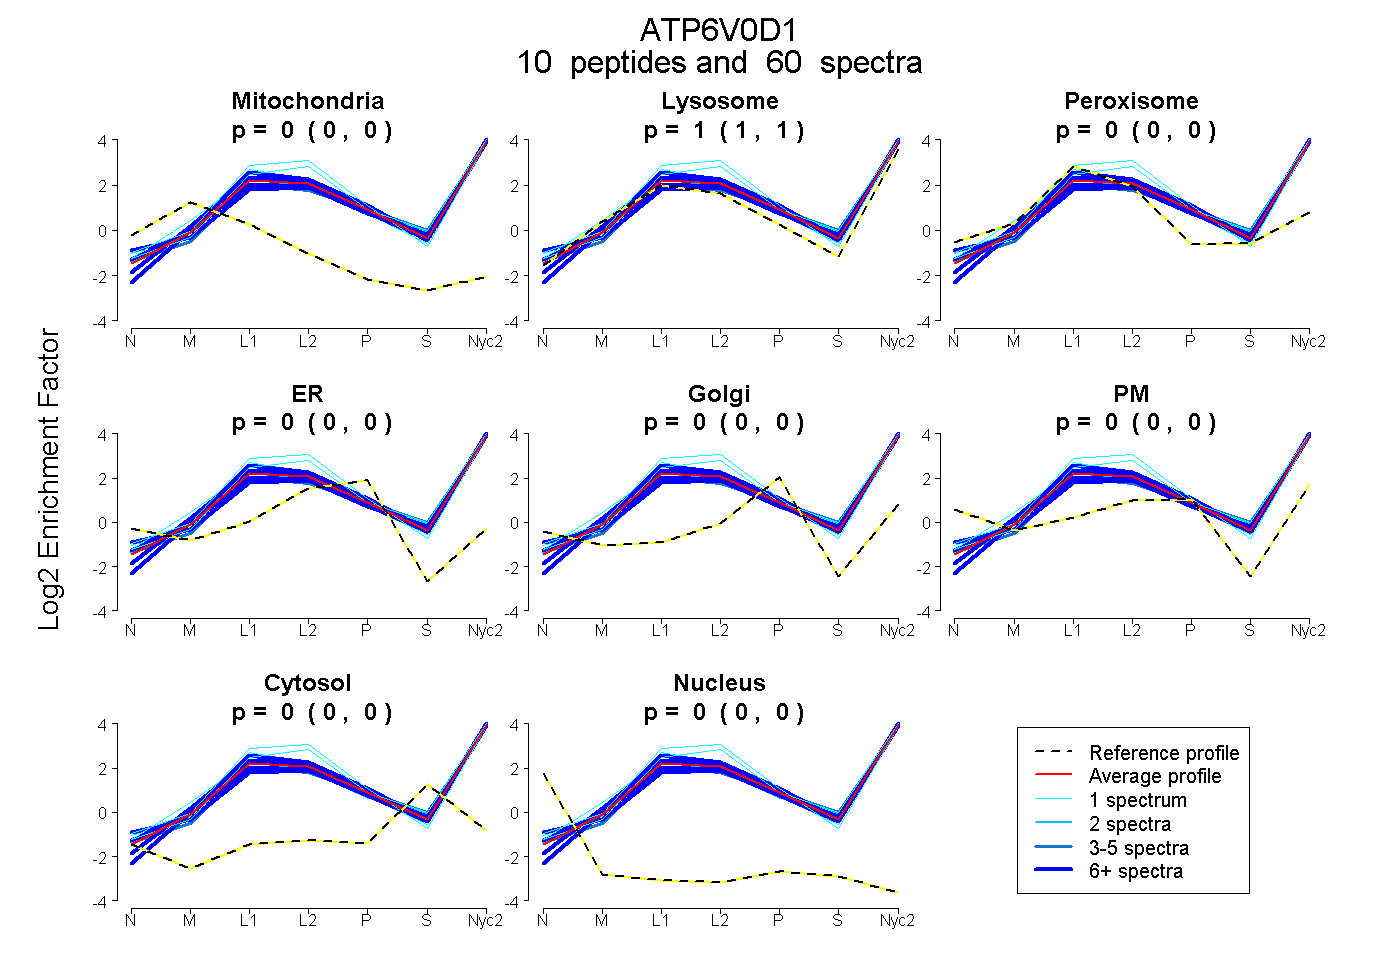 |
0.000
0.000 | 0.000 |
1.000
1.000 | 1.000 |
|
0.000
0.000 | 0.000 |
0.000
0.000 | 0.000 |
0.000
0.000 | 0.000 |
0.000
0.000 | 0.000 |
0.000
0.000 | 0.000 |
0.000
0.000 | 0.000 |
|
| | | Plot |
Mito |
|
Lyso or Perox |
|
ER |
Golgi |
PM |
Cytosol |
Nucleus |
|
| Expt B |
10
peptides |
38
spectra |
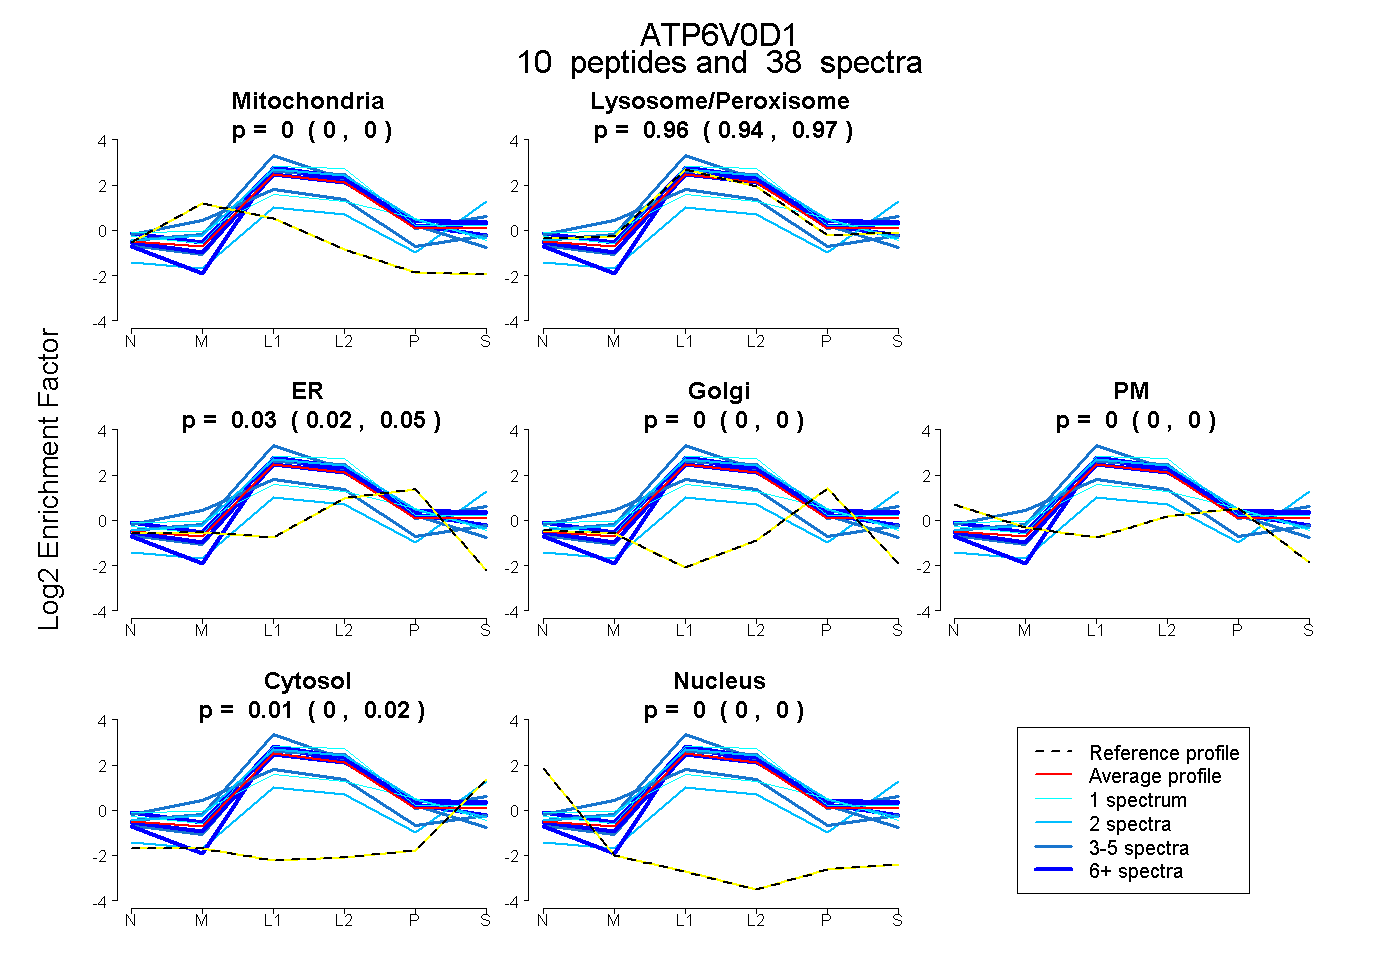 |
0.000
0.000 | 0.000 |
|
0.955
0.942 | 0.967 |
|
0.035
0.020 | 0.047 |
0.000
0.000 | 0.000 |
0.000
0.000 | 0.000 |
0.010
0.001 | 0.017 |
0.000
0.000 | 0.000 |
|
| | | Plot |
|
Lyso |
|
|
|
|
|
|
|
Other |
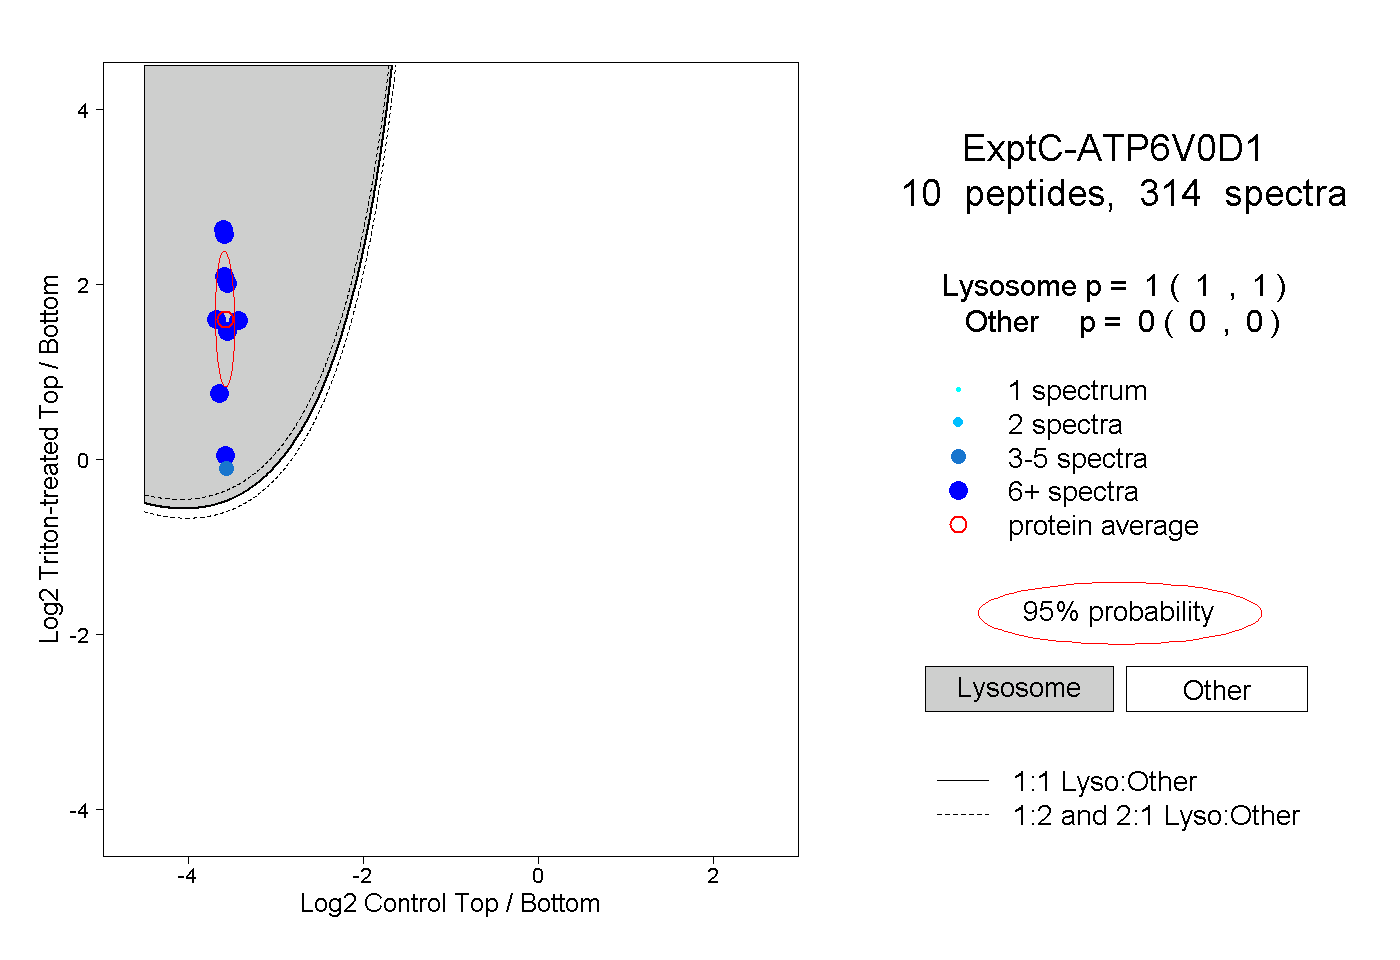
| Expt C |
10
peptides |
314
spectra |
 |
|
1.000
1.000 | 1.000 |
|
|
|
|
|
|
|
0.000
0.000 | 0.000 |
| | | Plot |
|
Lyso |
|
|
|
|
|
|
|
Other |
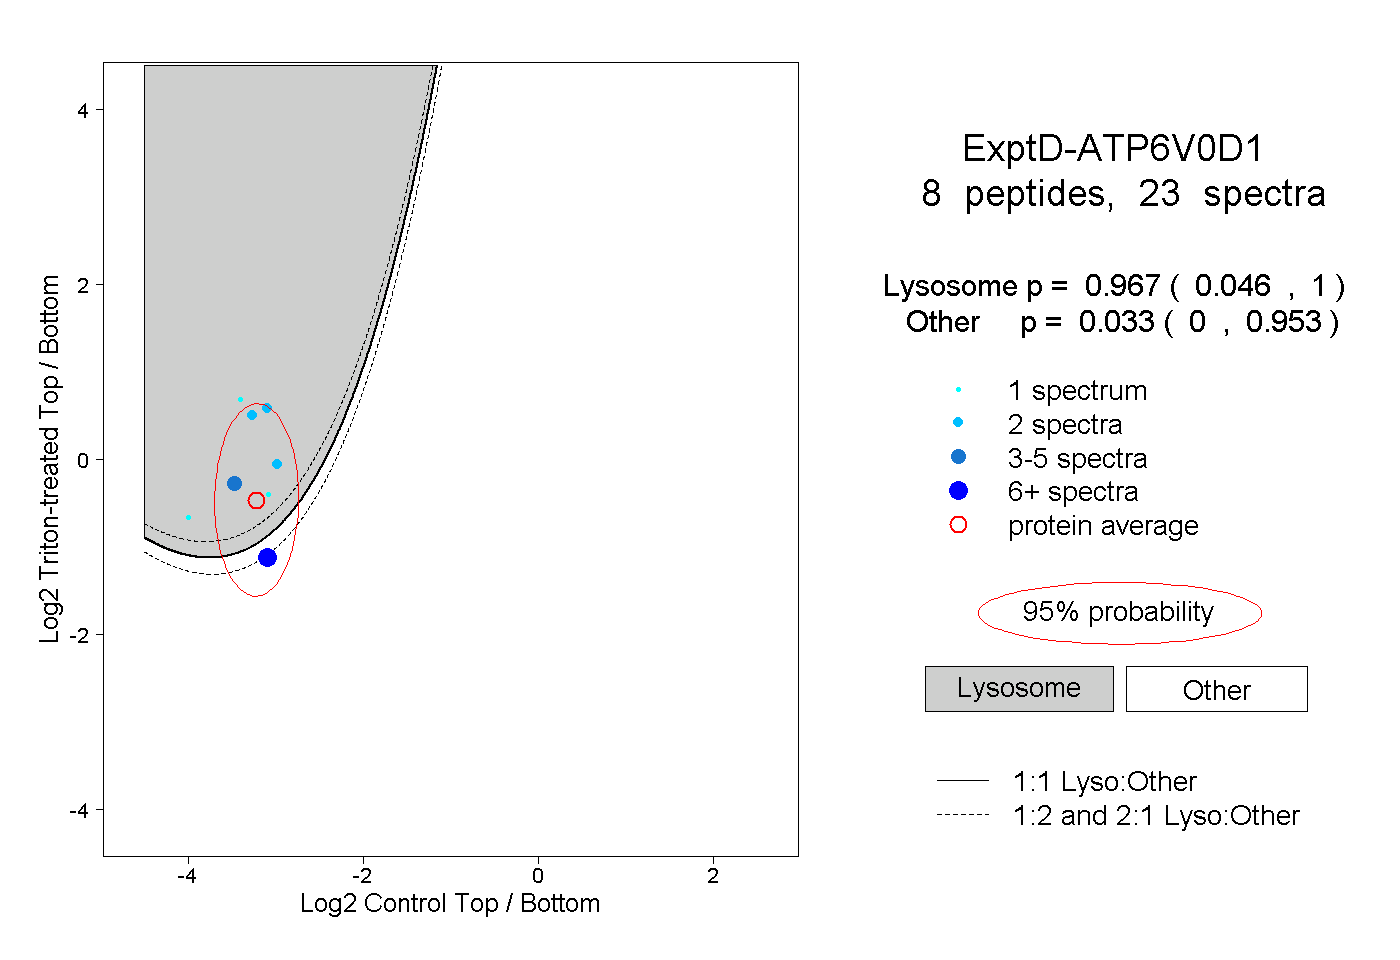
| Expt D |
8
peptides |
23
spectra |
 |
|
0.967
0.046 | 1.000 |
|
|
|
|
|
|
|
0.033
0.000 | 0.953 |
| 1 spectrum, SIAELVPK |
|
1.000 |
|
|
|
|
|
|
|
0.000 |
| 2 spectra, LYPEGLAQLAR |
|
1.000 |
|
|
|
|
|
|
|
0.000 |
| 2 spectra, LLFEGAGSNPGDK |
|
1.000 |
|
|
|
|
|
|
|
0.000 |
| 10 spectra, LFPHCGR |
|
0.169 |
|
|
|
|
|
|
|
0.831 |
| 1 spectrum, AYLESFYK |
|
0.969 |
|
|
|
|
|
|
|
0.031 |
| 1 spectrum, NIVWIAECIAQR |
|
0.955 |
|
|
|
|
|
|
|
0.045 |
| 4 spectra, ADDYEQVK |
|
0.997 |
|
|
|
|
|
|
|
0.003 |
| 2 spectra, FFEHEVK |
|
0.991 |
|
|
|
|
|
|
|
0.009 |