10
10peptides
spectra
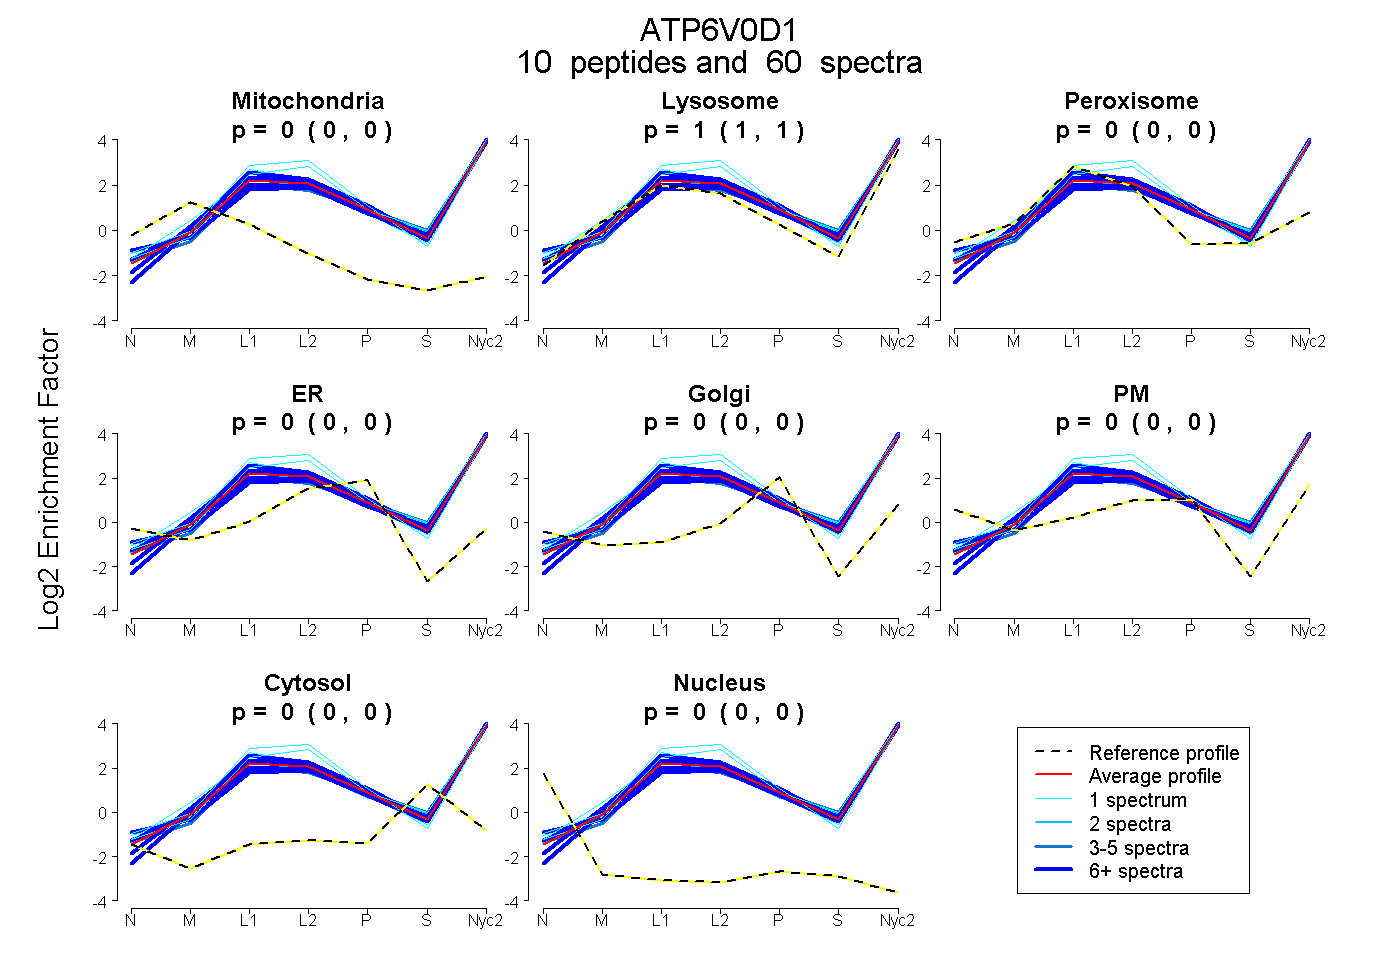
0.000 | 0.000
1.000 | 1.000
0.000 | 0.000
0.000 | 0.000
0.000 | 0.000
0.000 | 0.000
0.000 | 0.000
0.000 | 0.000
10peptides
spectra
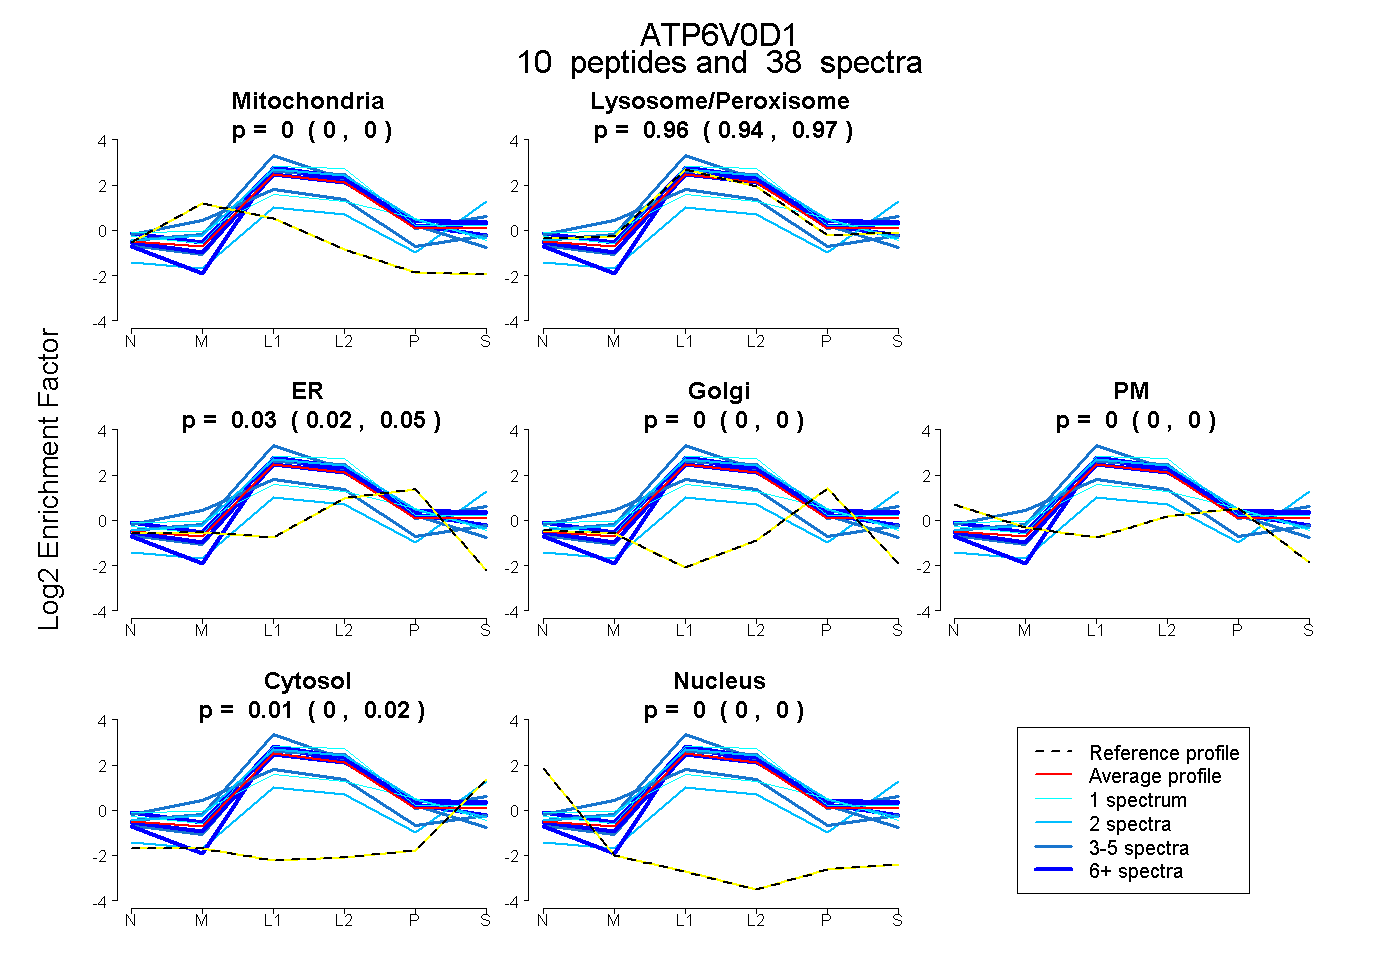
0.000 | 0.000
0.942 | 0.967
0.020 | 0.047
0.000 | 0.000
0.000 | 0.000
0.001 | 0.017
0.000 | 0.000
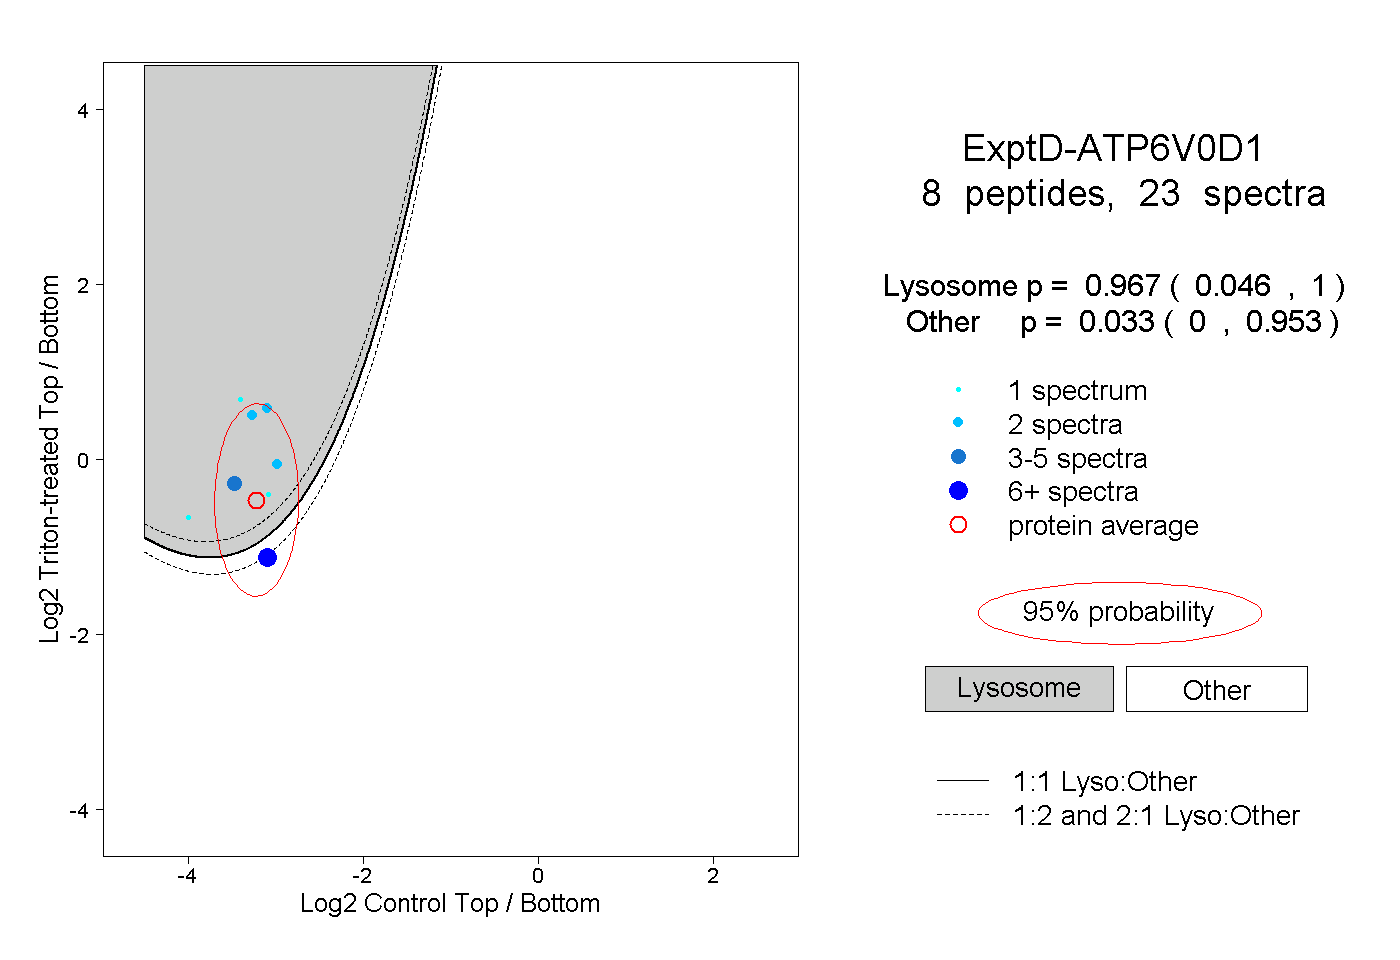
10peptides
spectra
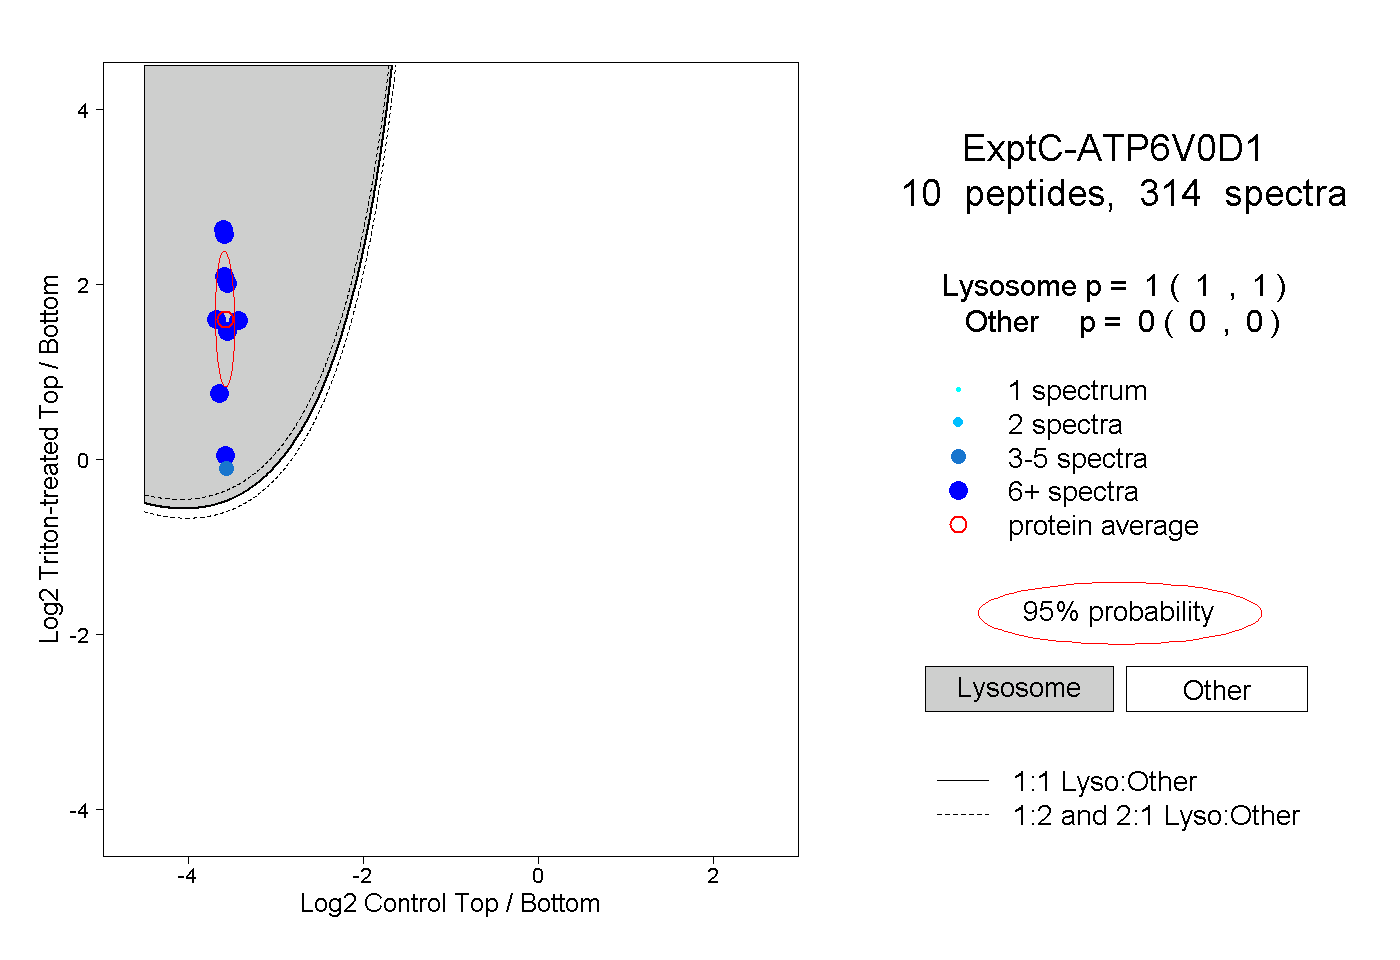
1.000 | 1.000
0.000 | 0.000