 7
7peptides
spectra
0.311 | 0.334
0.100 | 0.145
0.154 | 0.221
0.142 | 0.198
0.000 | 0.000
0.157 | 0.214
0.000 | 0.000
0.000 | 0.000
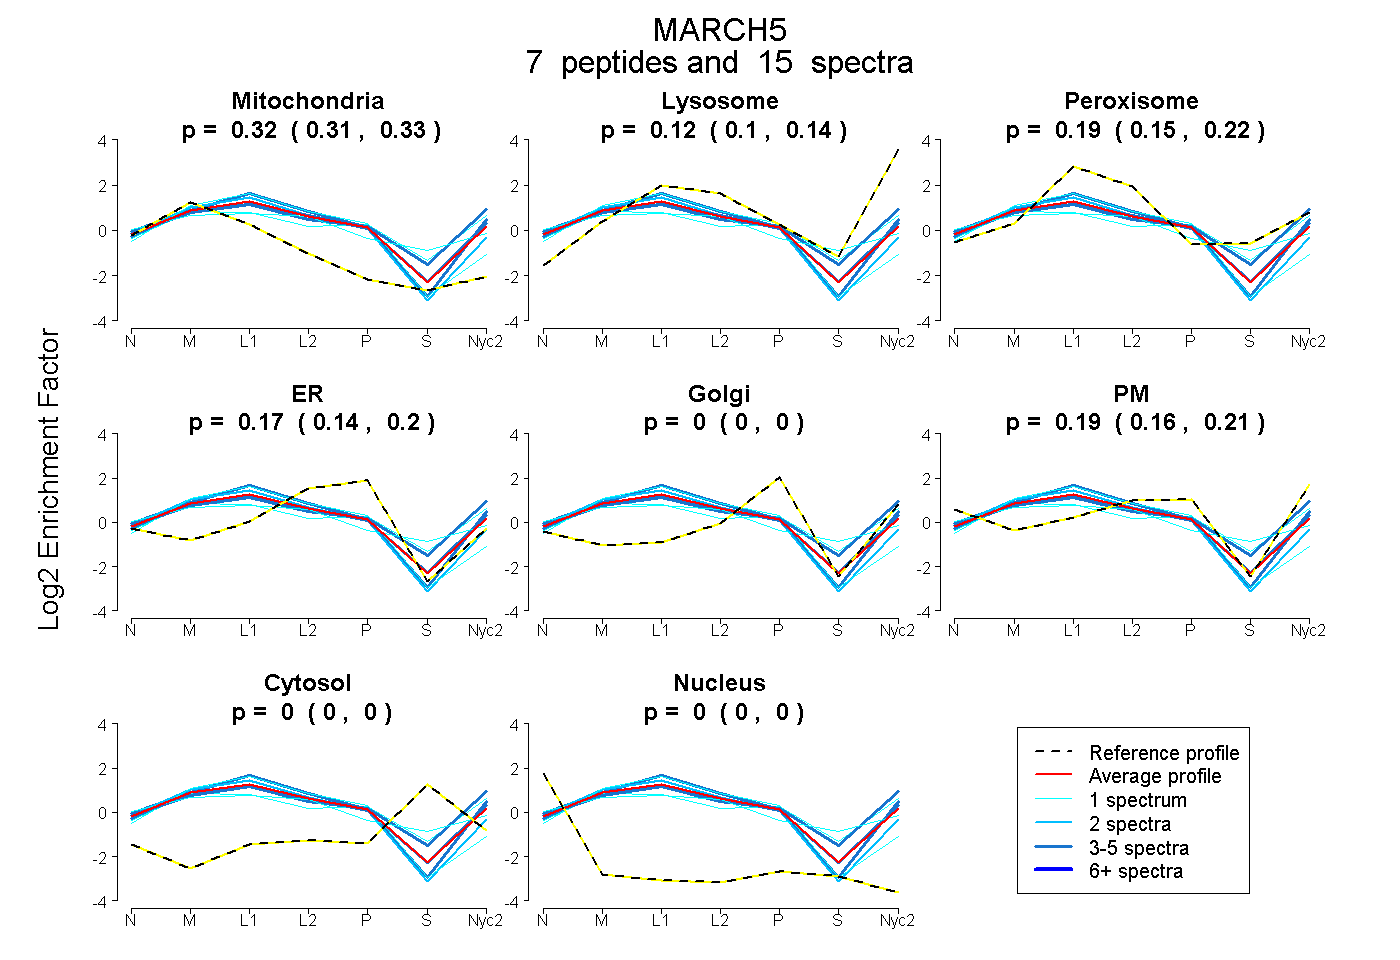
| Plot | Mito | Lyso | Perox | ER | Golgi | PM | Cytosol | Nucleus | |||||
| Expt A |
7 peptides |
15 spectra |
|
0.323 0.311 | 0.334 |
0.124 0.100 | 0.145 |
0.192 0.154 | 0.221 |
0.174 0.142 | 0.198 |
0.000 0.000 | 0.000 |
0.188 0.157 | 0.214 |
0.000 0.000 | 0.000 |
0.000 0.000 | 0.000 |
| 1 spectrum, WVHQACLQR | 0.275 | 0.000 | 0.372 | 0.033 | 0.000 | 0.213 | 0.106 | 0.000 | ||
| 3 spectra, WEDYVLR | 0.240 | 0.207 | 0.221 | 0.000 | 0.078 | 0.253 | 0.000 | 0.000 | ||
| 1 spectrum, SCWVCFATDEDDR | 0.378 | 0.000 | 0.234 | 0.388 | 0.000 | 0.000 | 0.000 | 0.000 | ||
| 3 spectra, LMFSSVNSNLQR | 0.333 | 0.199 | 0.126 | 0.178 | 0.000 | 0.164 | 0.000 | 0.000 | ||
| 4 spectra, EGLDVMER | 0.277 | 0.117 | 0.196 | 0.097 | 0.000 | 0.314 | 0.000 | 0.000 | ||
| 1 spectrum, TILGGIAFVAIK | 0.290 | 0.235 | 0.195 | 0.000 | 0.280 | 0.000 | 0.000 | 0.000 | ||
| 2 spectra, LGPVVYVLDLADR | 0.388 | 0.090 | 0.141 | 0.290 | 0.000 | 0.091 | 0.000 | 0.000 |
| Plot | Mito | Lyso or Perox | ER | Golgi | PM | Cytosol | Nucleus | ||||||
| Expt B |
3 peptides |
3 spectra |
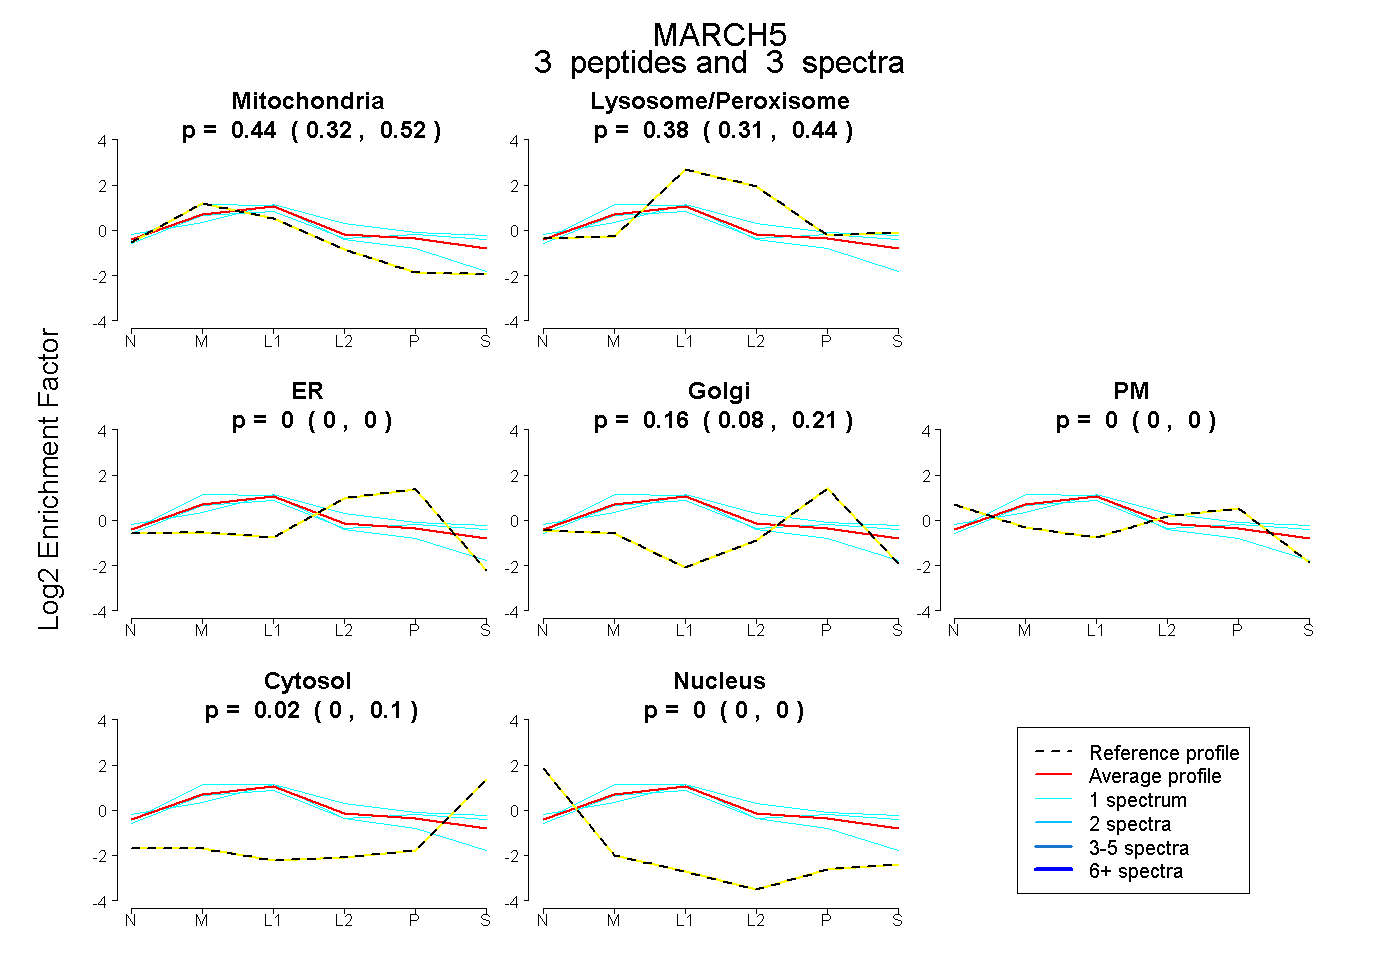 |
0.437 0.324 | 0.517 |
0.381 0.310 | 0.441 |
0.000 0.000 | 0.000 |
0.163 0.081 | 0.211 |
0.000 0.000 | 0.000 |
0.019 0.000 | 0.097 |
0.000 0.000 | 0.000 |
|||
| Plot | Lyso | Other | |||||||||||
| Expt C |
9 peptides |
58 spectra |
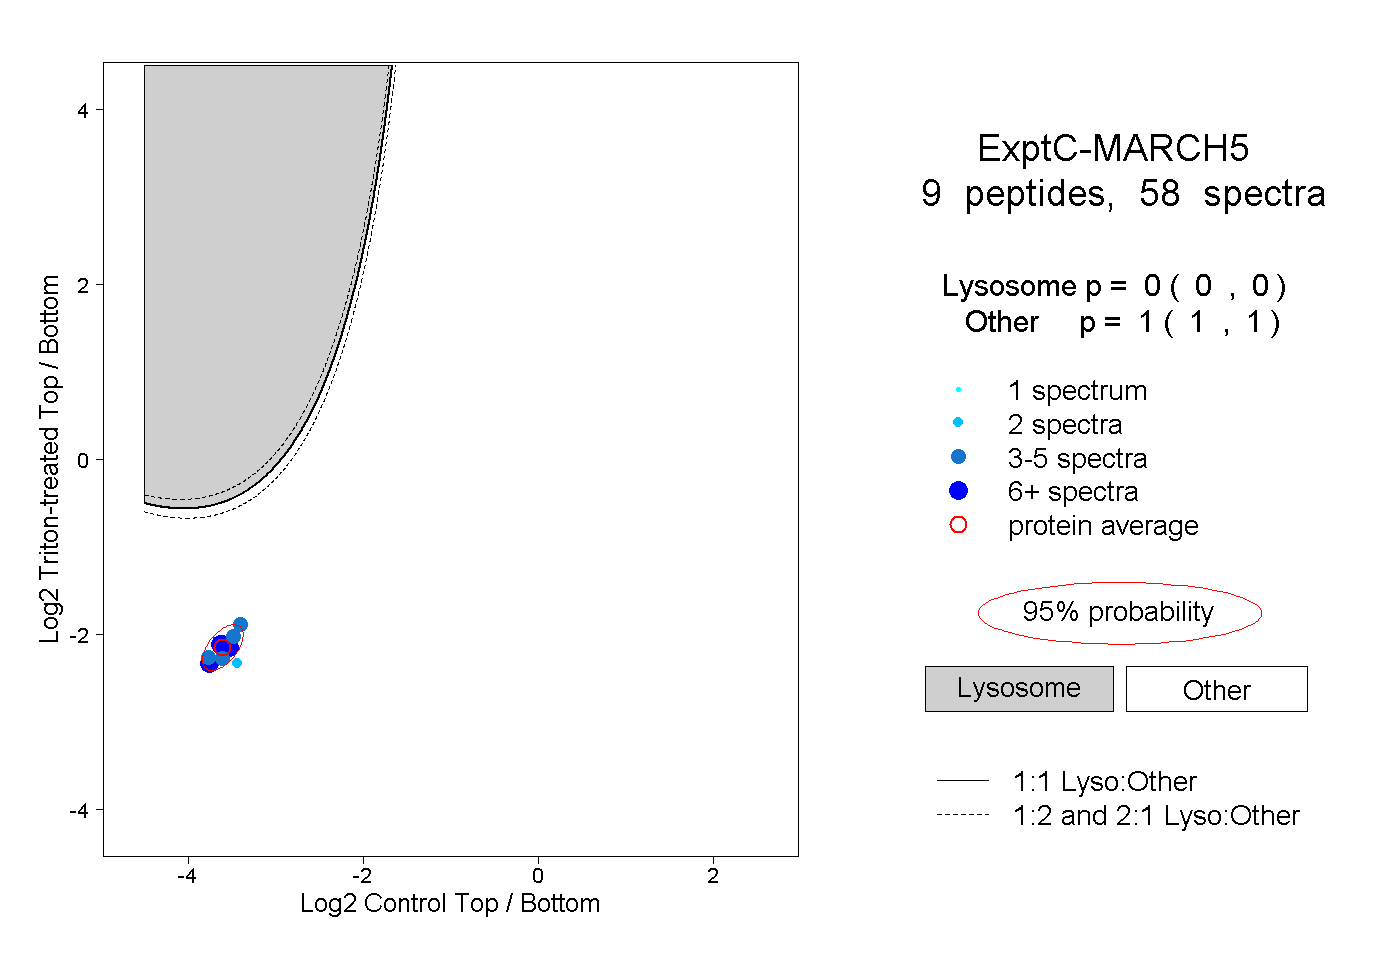 |
0.000 0.000 | 0.000 |
1.000 1.000 | 1.000 |
||||||||
| Plot | Lyso | Other | |||||||||||
| Expt D |
2 peptides |
5 spectra |
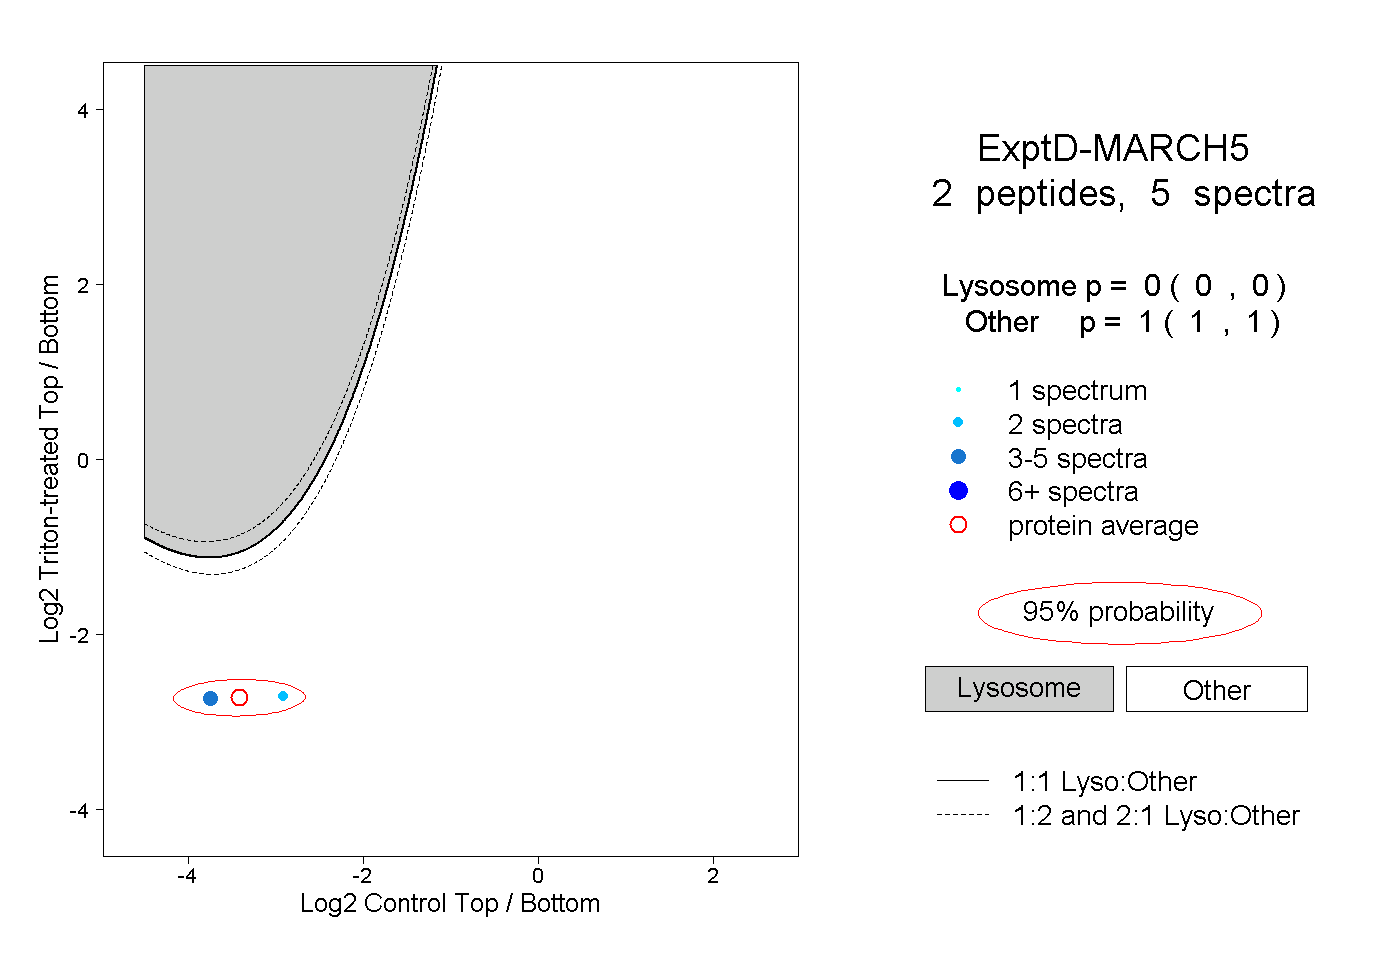 |
0.000 0.000 | 0.000 |
1.000 1.000 | 1.000 |