 3
3peptides
spectra
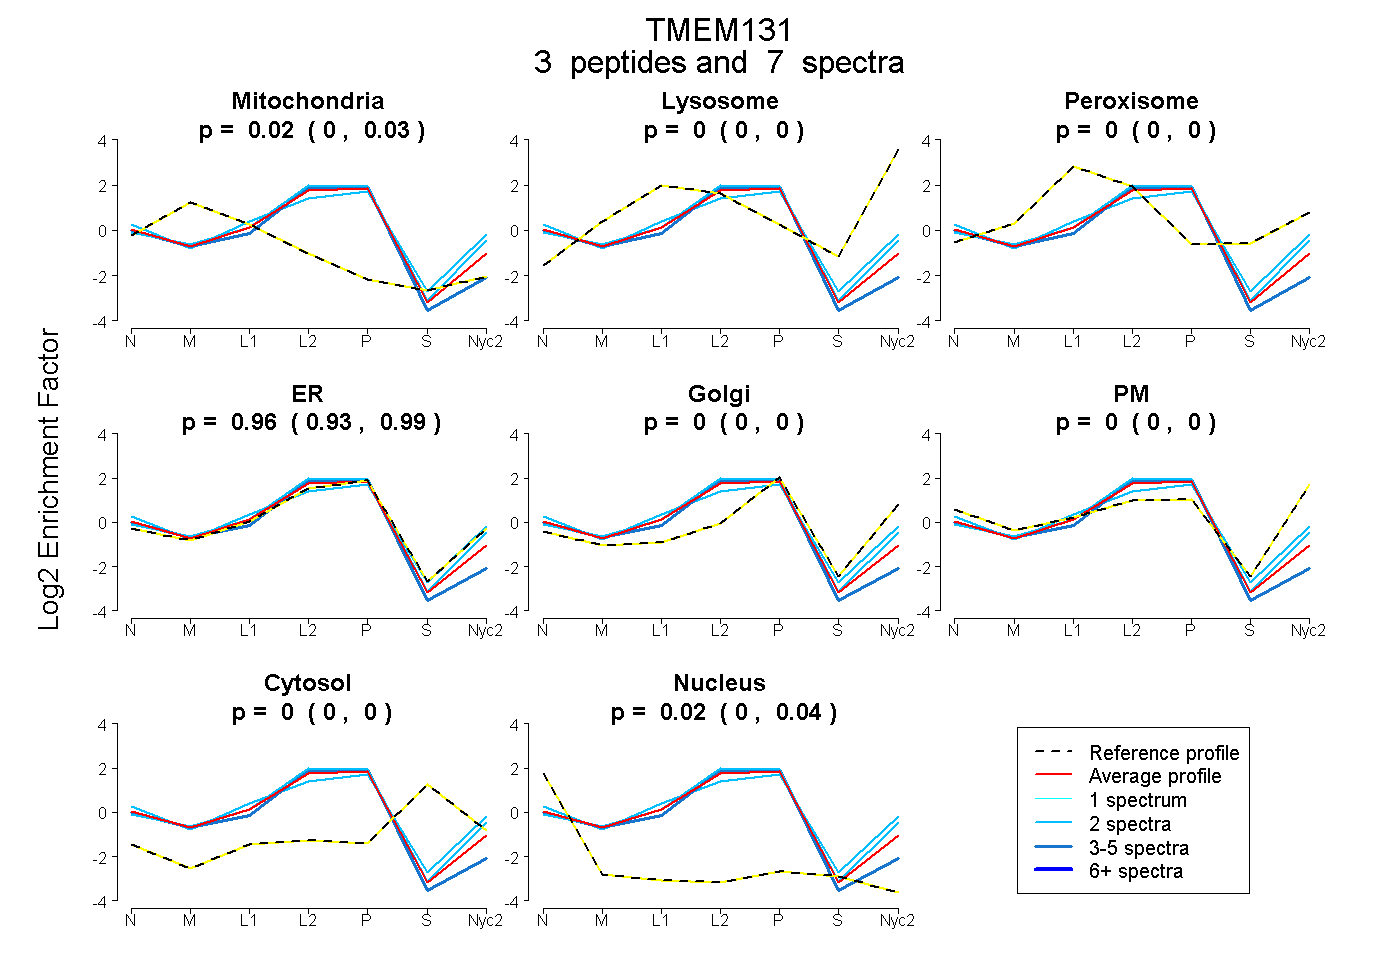
0.000 | 0.033
0.000 | 0.000
0.000 | 0.000
0.929 | 0.986
0.000 | 0.000
0.000 | 0.000
0.000 | 0.000
0.000 | 0.044
1peptide
spectra
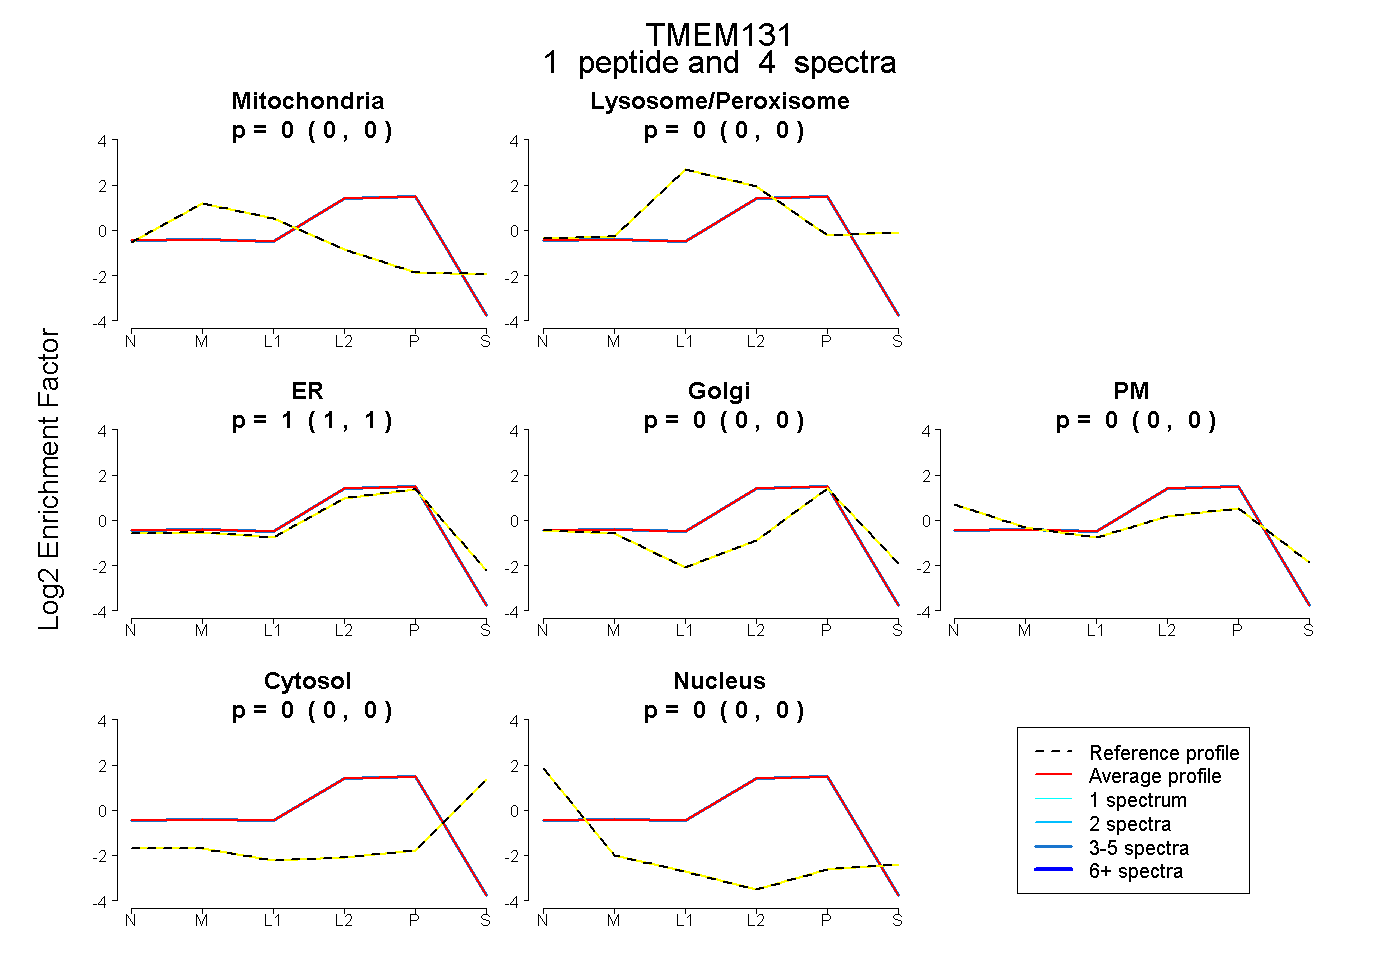
0.000 | 0.000
0.000 | 0.000
1.000 | 1.000
0.000 | 0.000
0.000 | 0.000
0.000 | 0.000
0.000 | 0.000
5peptides
spectra
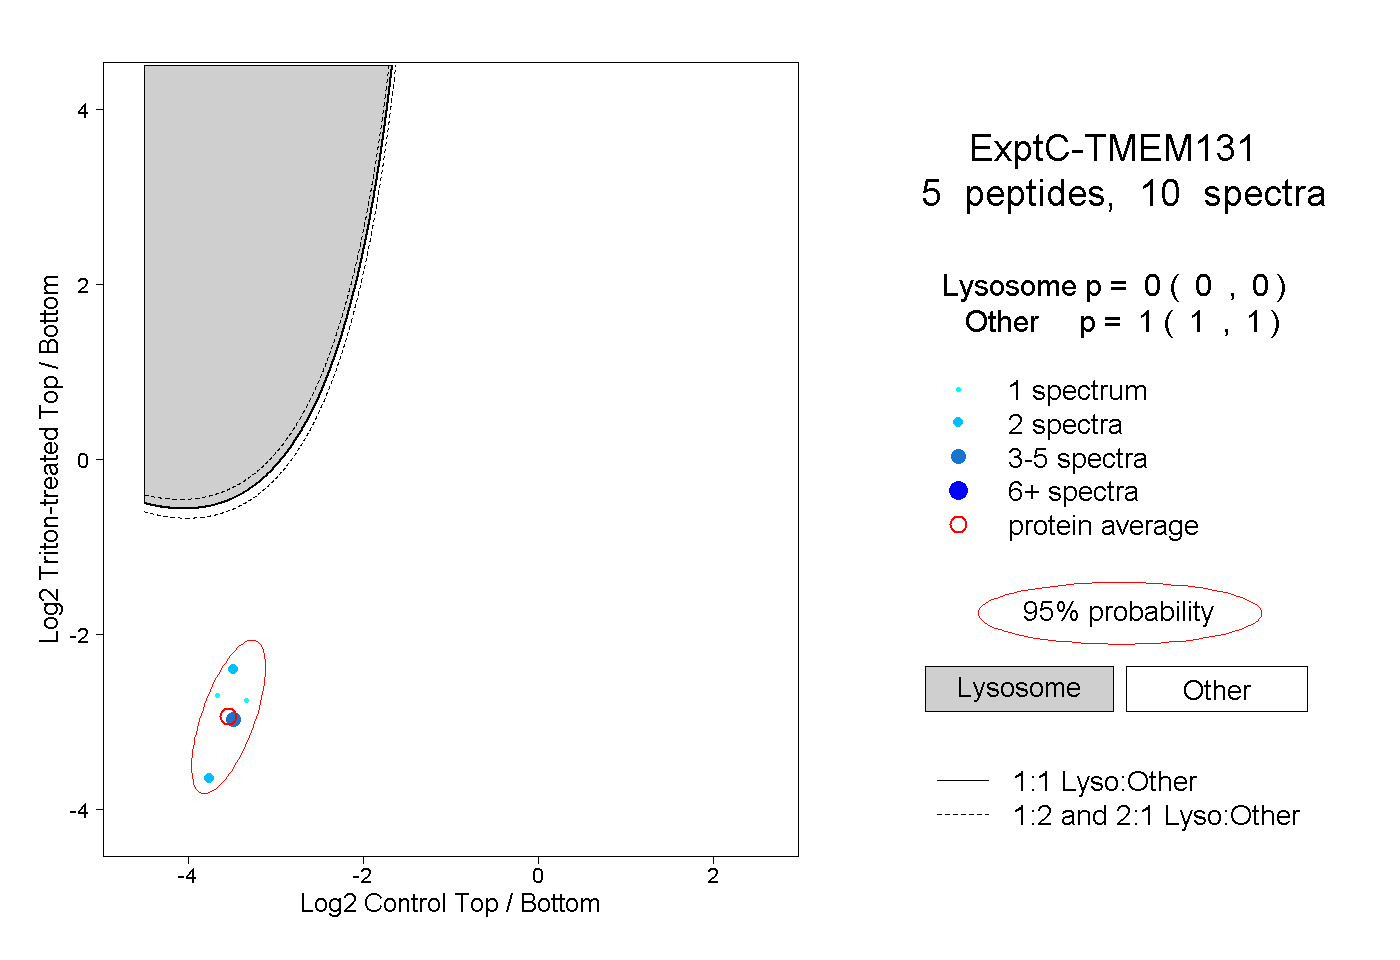
0.000 | 0.000
1.000 | 1.000
1peptide
spectra
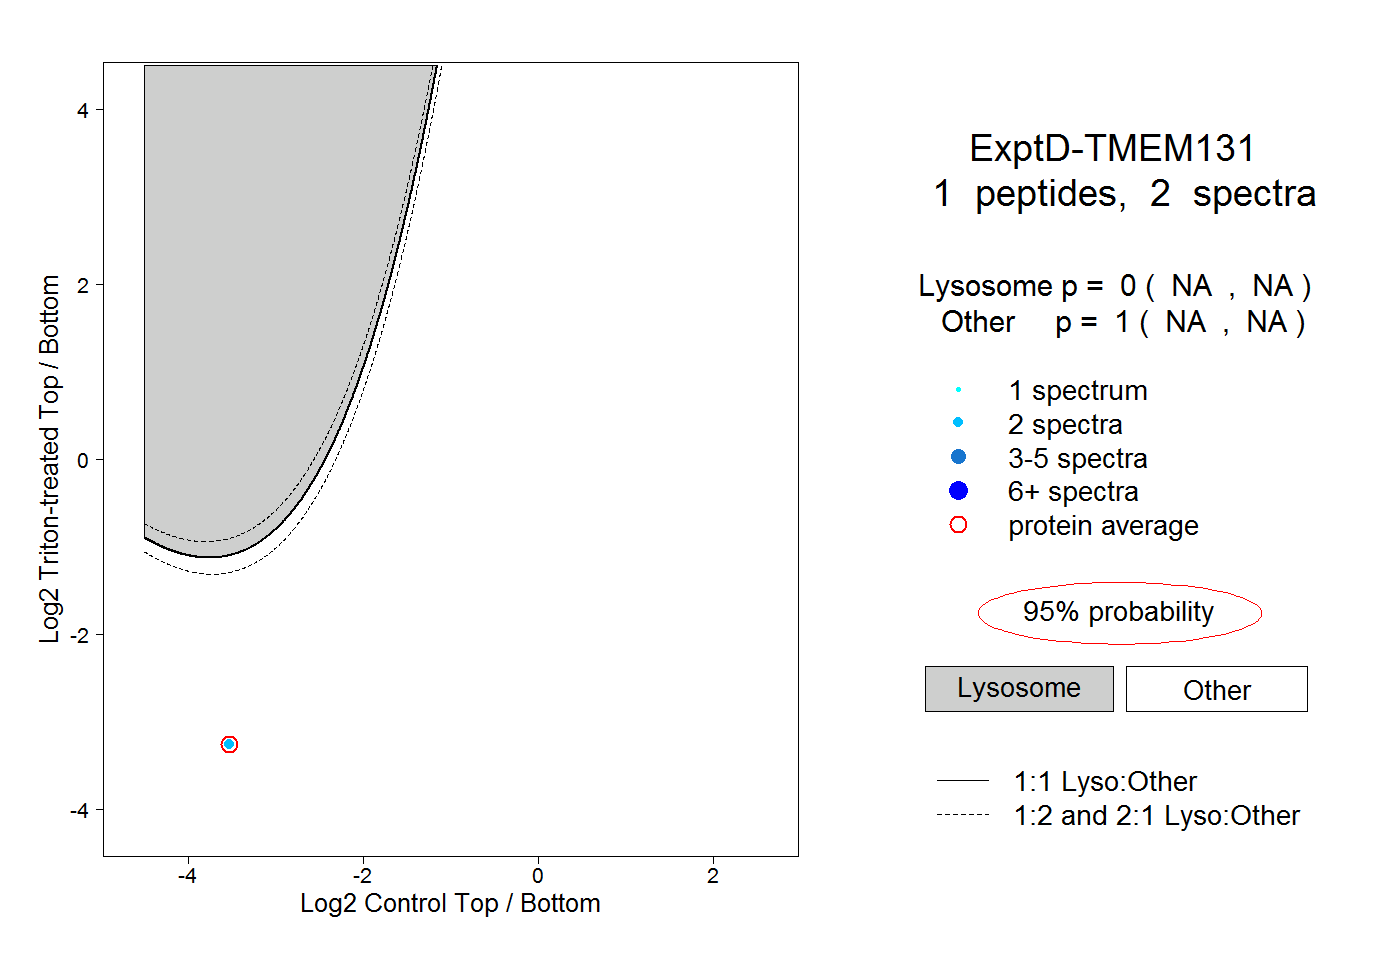
NA | NA
NA | NA