 5
5peptides
spectra
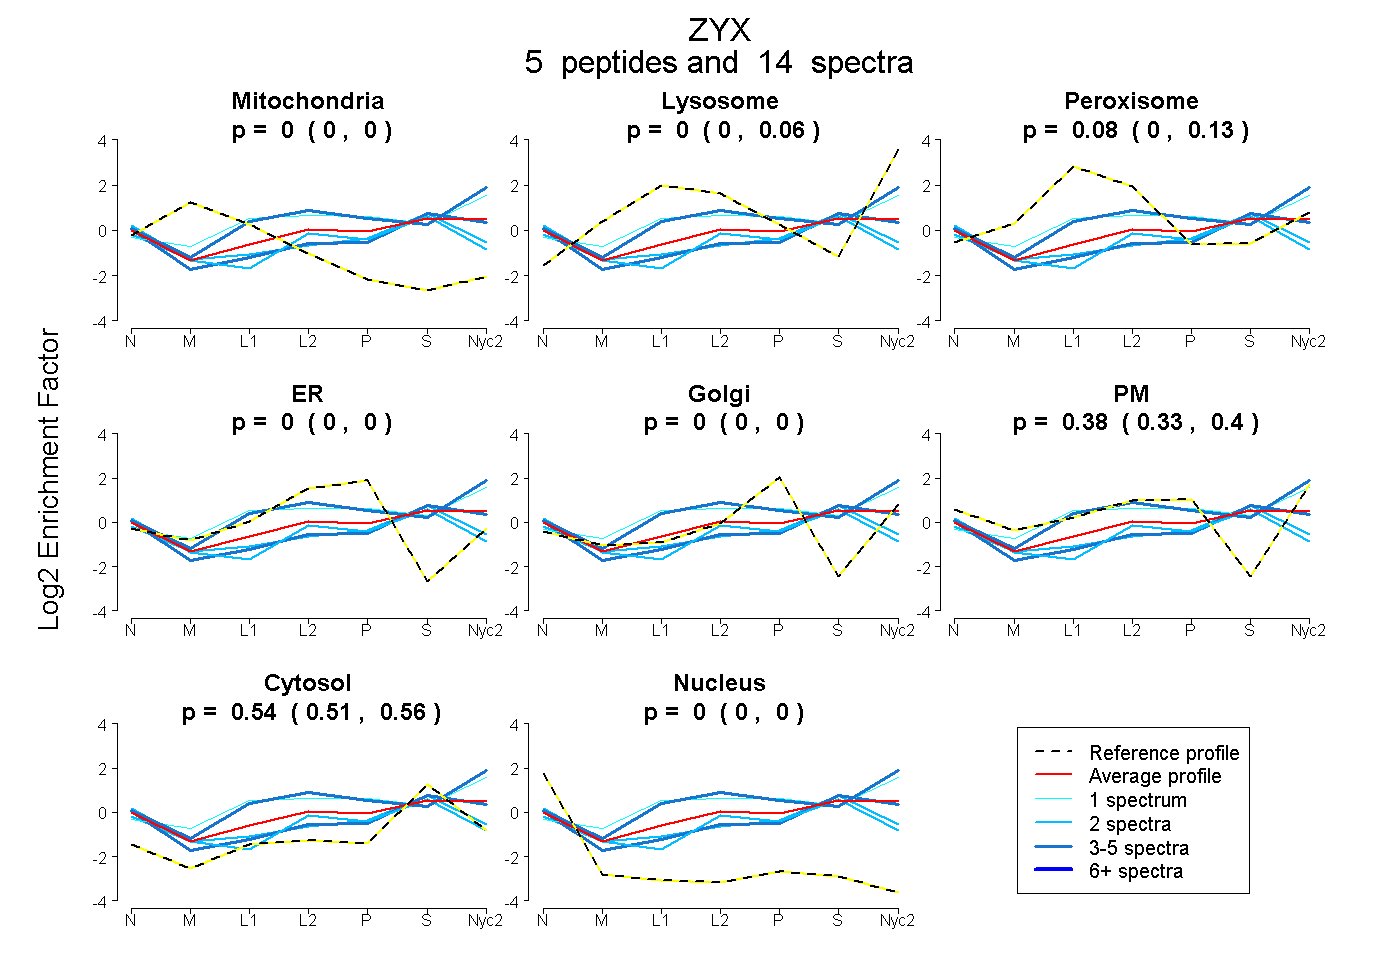
0.000 | 0.000
0.000 | 0.063
0.001 | 0.126
0.000 | 0.000
0.000 | 0.000
0.334 | 0.401
0.514 | 0.560
0.000 | 0.000
1peptide
spectrum
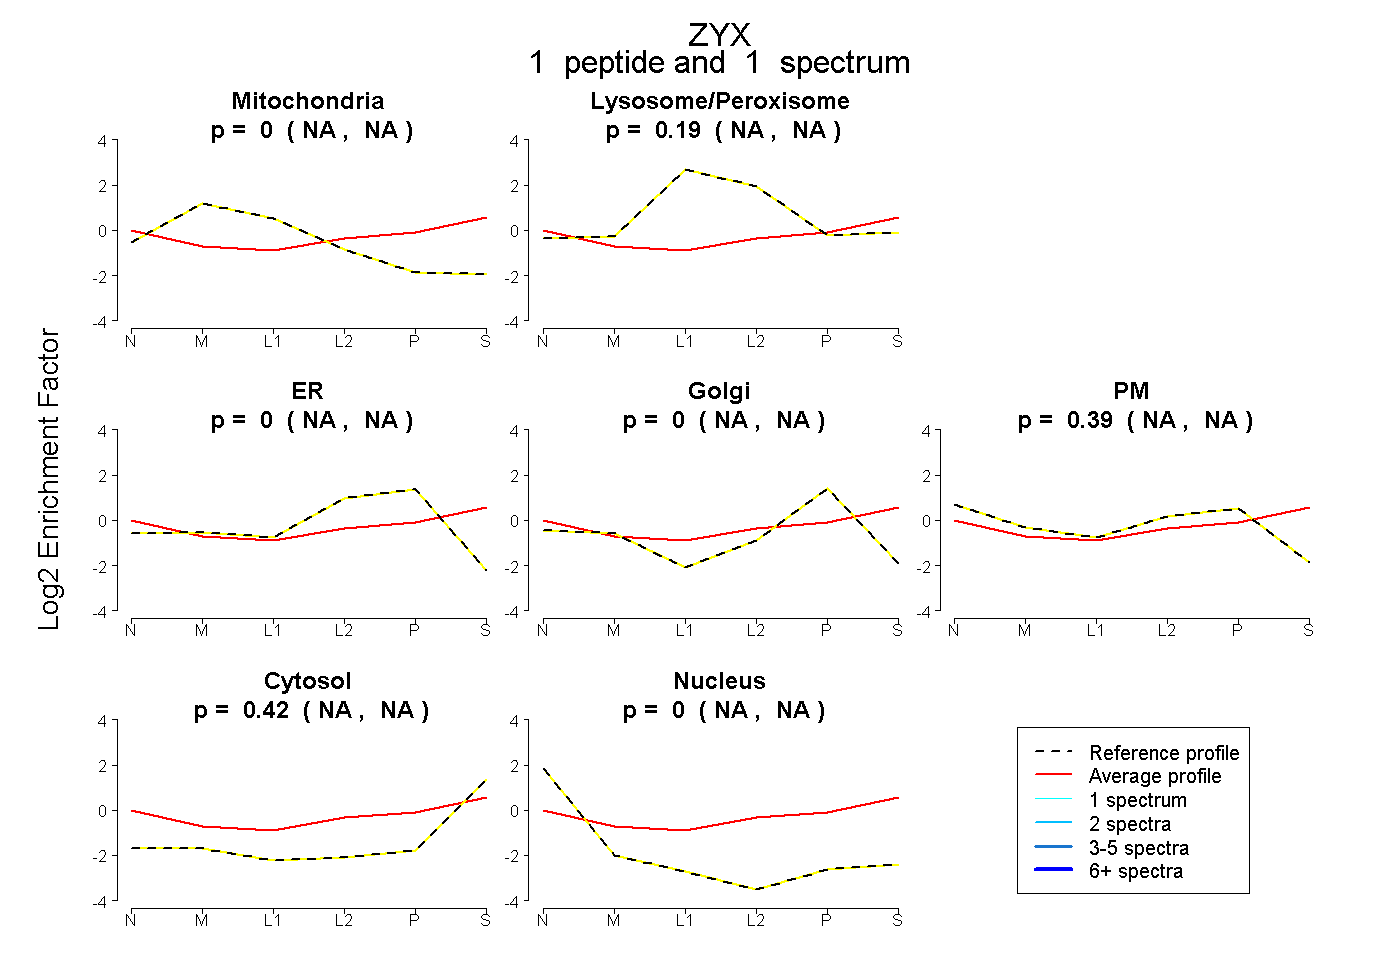
NA | NA
NA | NA
NA | NA
NA | NA
NA | NA
NA | NA
NA | NA
11peptides
spectra
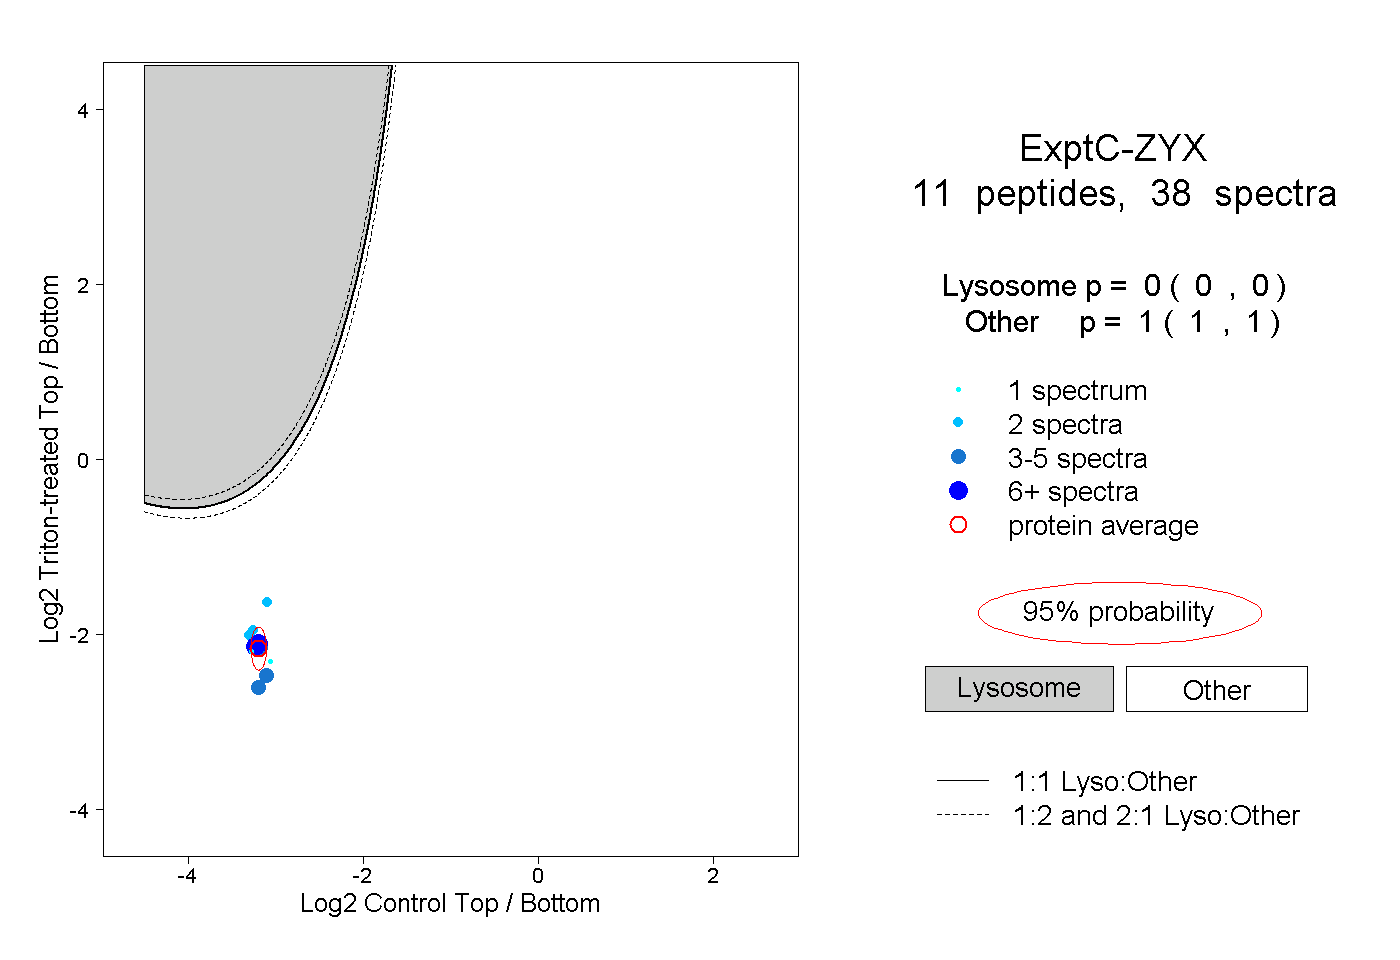
0.000 | 0.000
1.000 | 1.000
2peptides
spectra
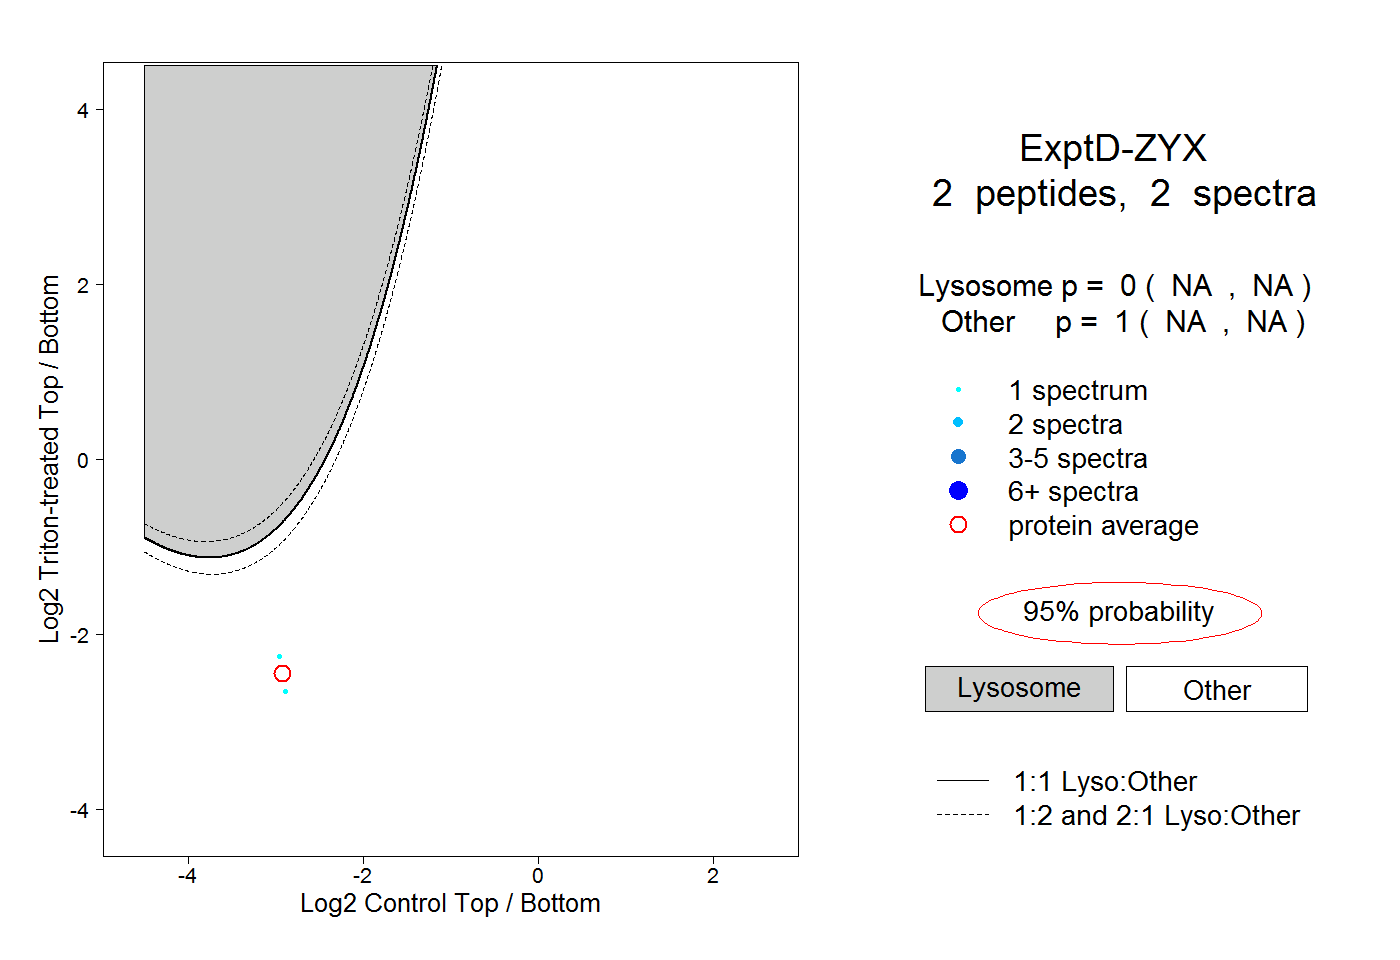
NA | NA
NA | NA