 9
9peptides
spectra
0.000 | 0.000
0.000 | 0.000
0.000 | 0.000
0.903 | 0.914
0.000 | 0.000
0.000 | 0.000
0.000 | 0.000
0.085 | 0.096
8peptides
spectra
0.000 | 0.000
1.000 | 1.000
| Plot | Mito | Lyso | Perox | ER | Golgi | PM | Cytosol | Nucleus | |||||
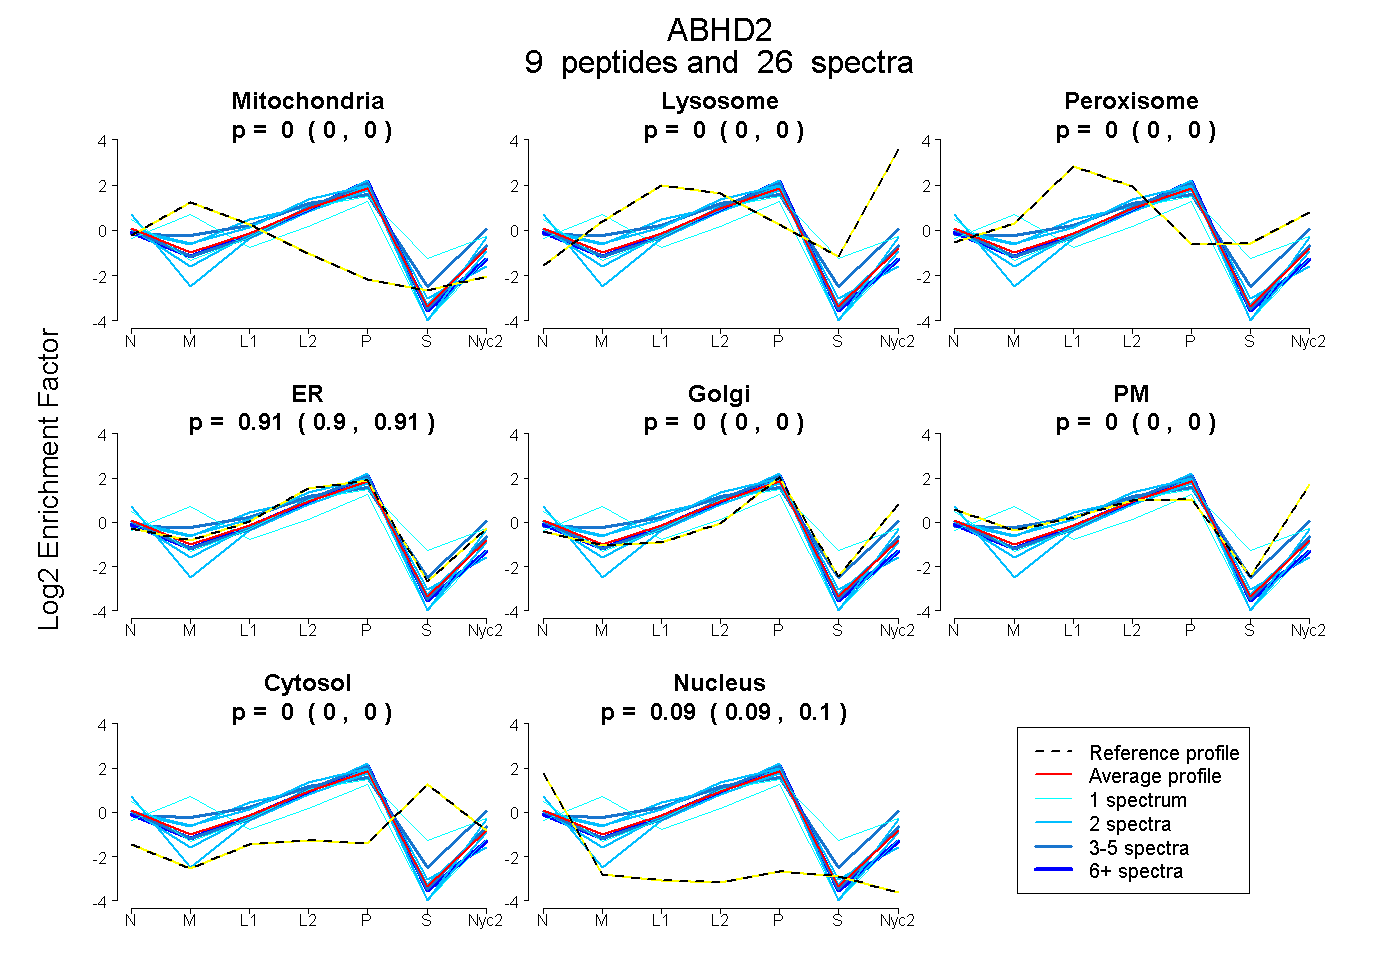
| Expt A |
9 peptides |
26 spectra |
|
0.000 0.000 | 0.000 |
0.000 0.000 | 0.000 |
0.000 0.000 | 0.000 |
0.909 0.903 | 0.914 |
0.000 0.000 | 0.000 |
0.000 0.000 | 0.000 |
0.000 0.000 | 0.000 |
0.091 0.085 | 0.096 |
||
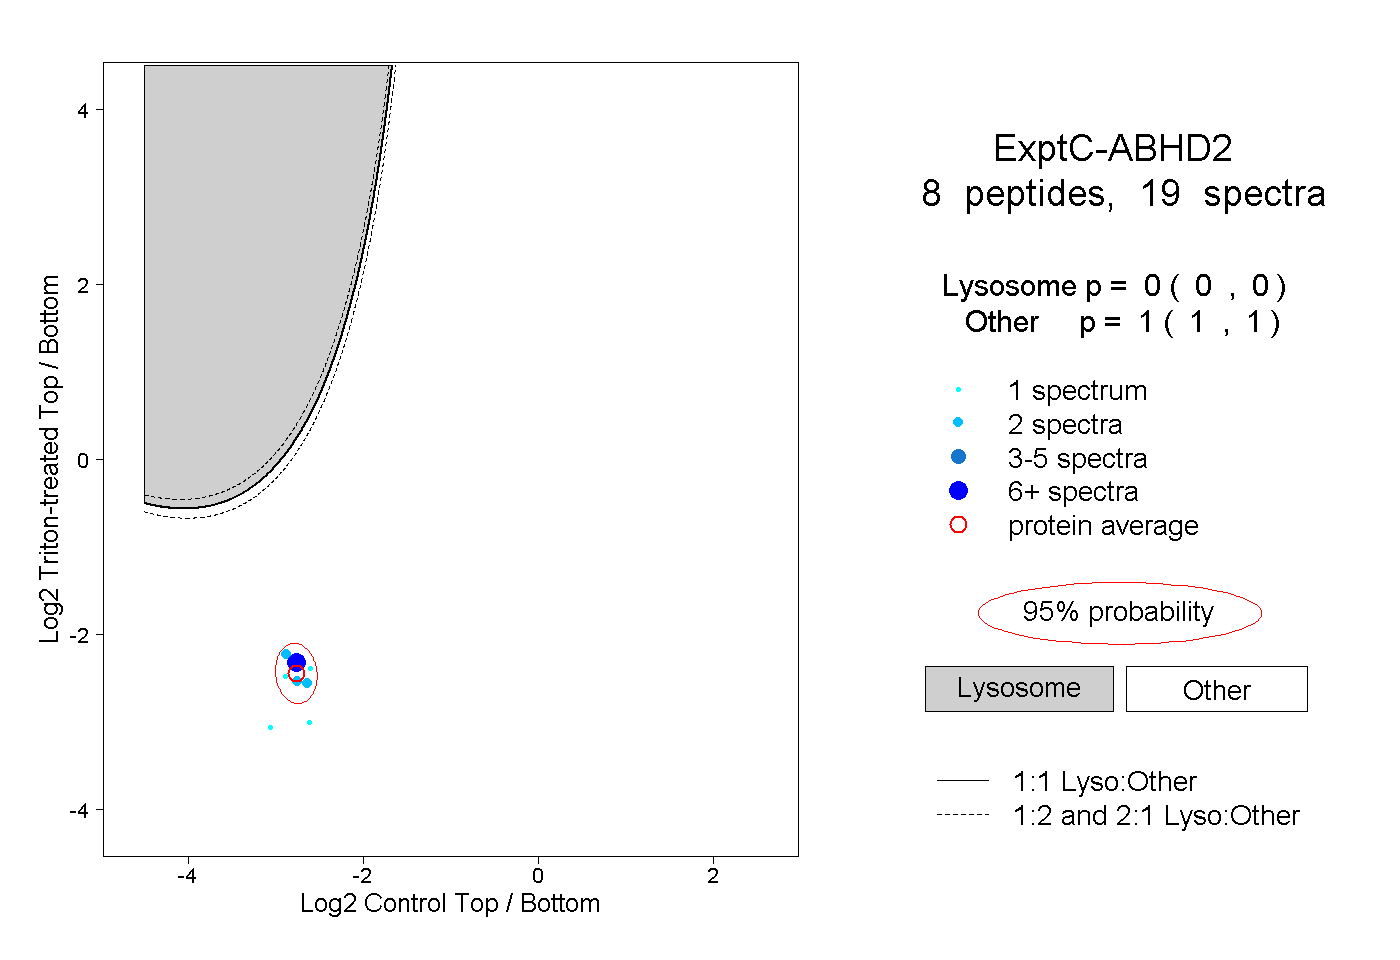
| Plot | Lyso | Other | |||||||||||
| Expt C |
8 peptides |
19 spectra |
|
0.000 0.000 | 0.000 |
1.000 1.000 | 1.000 |