CGNL1
[ENSRNOP00000023458]
Main page
| | | Plot |
Mito |
Lyso |
|
Perox |
ER |
Golgi |
PM |
Cytosol |
Nucleus |
|
| Expt A |
 21
21
peptides |
38
spectra |
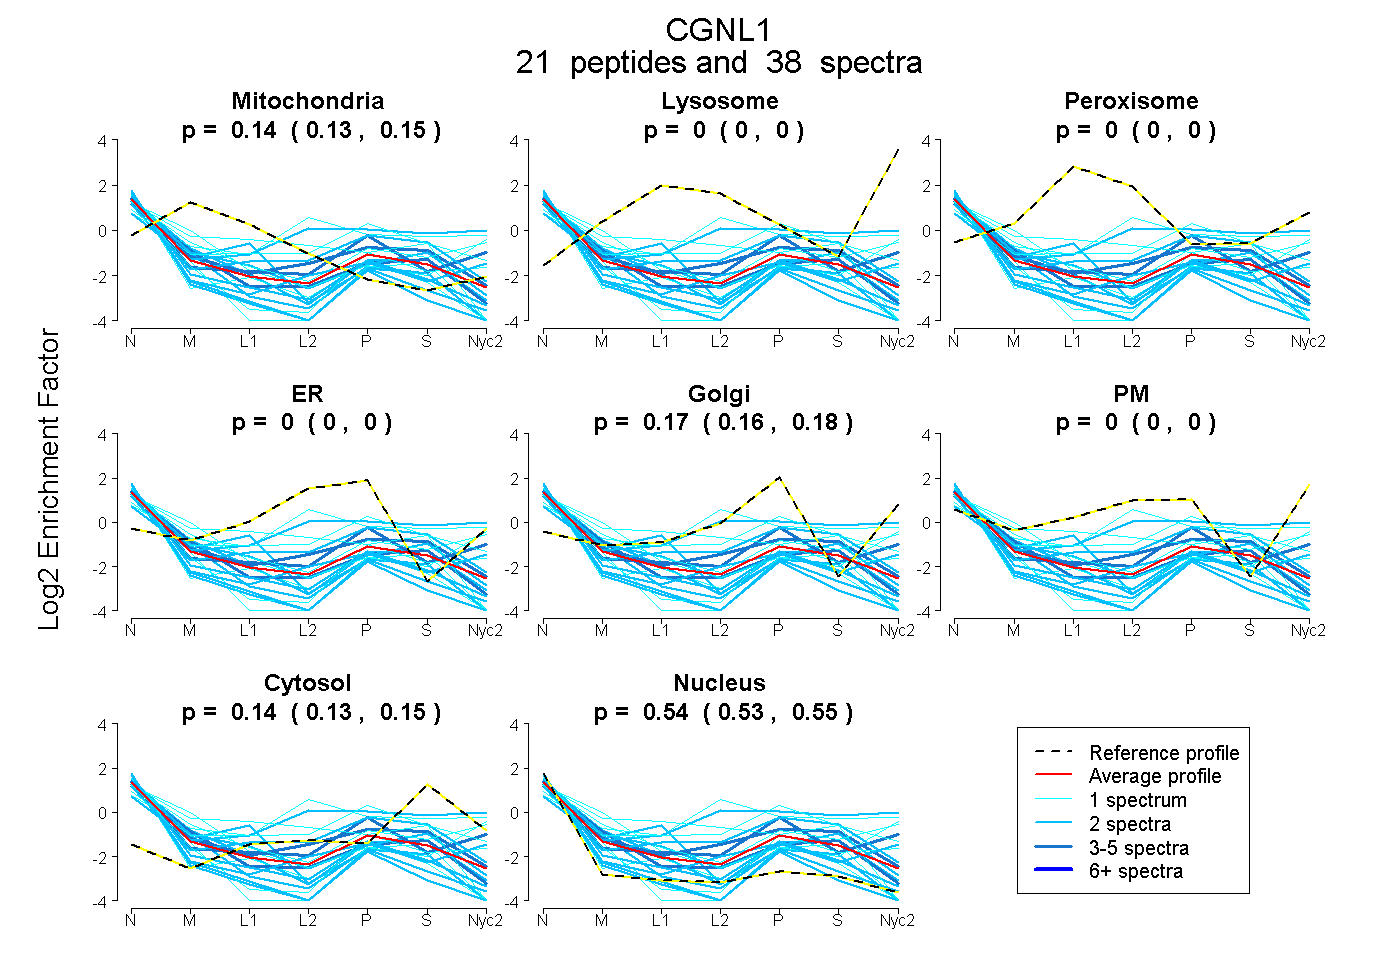 |
0.142
0.131 | 0.152 |
0.000
0.000 | 0.000 |
|
0.000
0.000 | 0.000 |
0.000
0.000 | 0.000 |
0.170
0.157 | 0.179 |
0.000
0.000 | 0.000 |
0.143
0.132 | 0.152 |
0.545
0.534 | 0.553 |
|
| | | Plot |
Mito |
|
Lyso or Perox |
|
ER |
Golgi |
PM |
Cytosol |
Nucleus |
|
| Expt B |
6
peptides |
9
spectra |
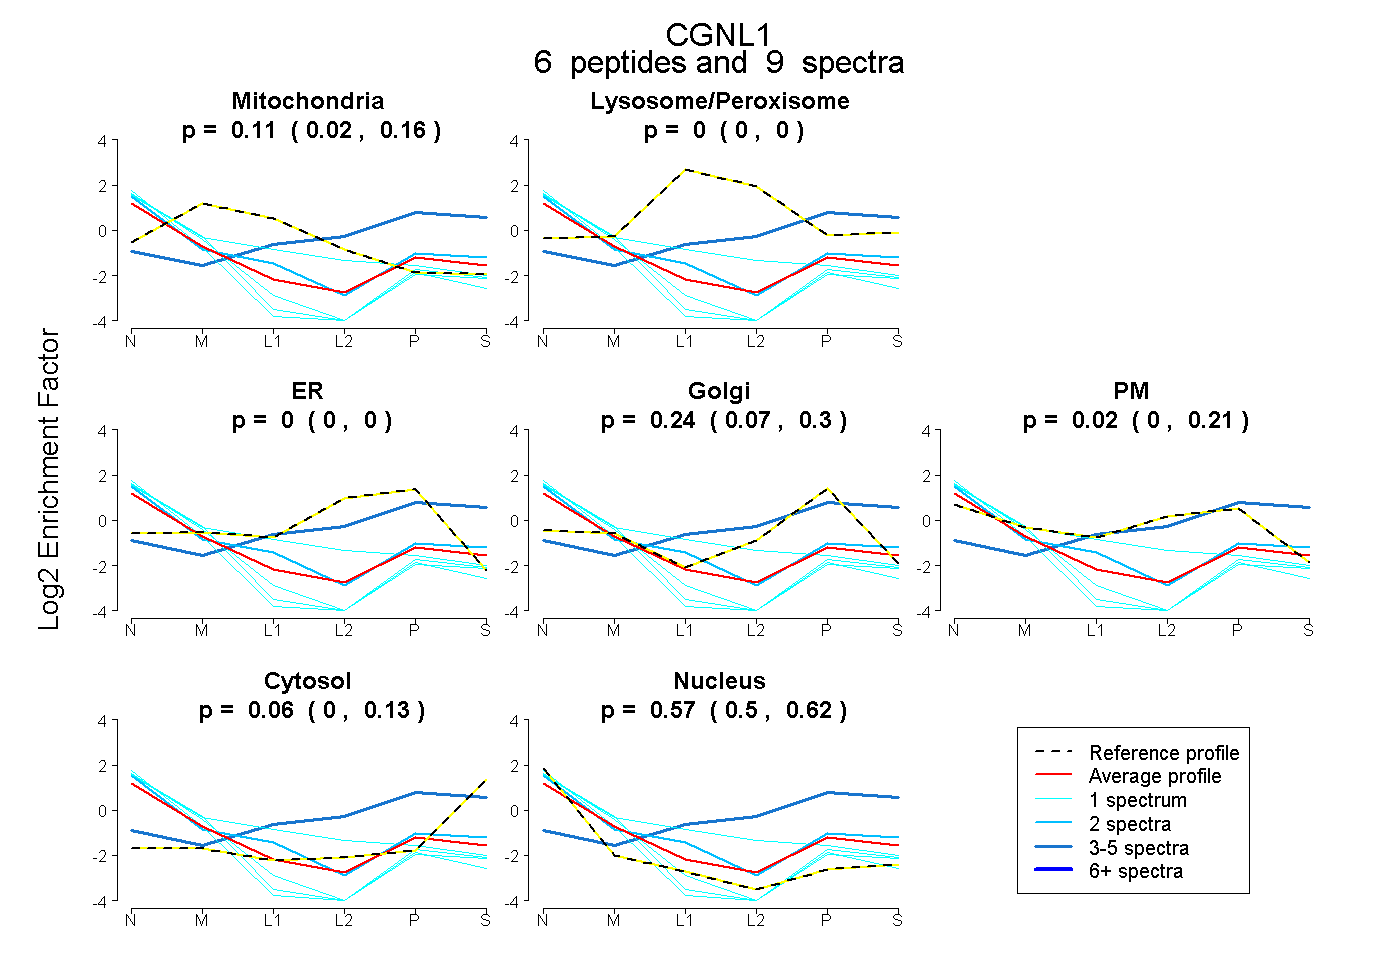 |
0.110
0.020 | 0.160 |
|
0.000
0.000 | 0.000 |
|
0.000
0.000 | 0.000 |
0.239
0.068 | 0.304 |
0.023
0.000 | 0.205 |
0.063
0.000 | 0.125 |
0.566
0.495 | 0.621 |
|
| 1 spectrum, NLEELFQVK |
0.000 |
|
0.000 |
|
0.000 |
0.127 |
0.000 |
0.000 |
0.873 |
|
| 1 spectrum, YIPFLPGTGR |
0.000 |
|
0.000 |
|
0.000 |
0.093 |
0.000 |
0.000 |
0.907 |
|
| 2 spectra, LPHVLNFQR |
0.049 |
|
0.058 |
|
0.000 |
0.063 |
0.181 |
0.078 |
0.571 |
|
| 1 spectrum, GALIEELLQAK |
0.044 |
|
0.000 |
|
0.000 |
0.128 |
0.000 |
0.000 |
0.827 |
|
| 1 spectrum, EEQEDLLR |
0.230 |
|
0.085 |
|
0.000 |
0.000 |
0.258 |
0.000 |
0.427 |
|
| 3 spectra, AAELER |
0.000 |
|
0.311 |
|
0.000 |
0.339 |
0.000 |
0.351 |
0.000 |
|
| | | Plot |
|
Lyso |
|
|
|
|
|
|
|
Other |
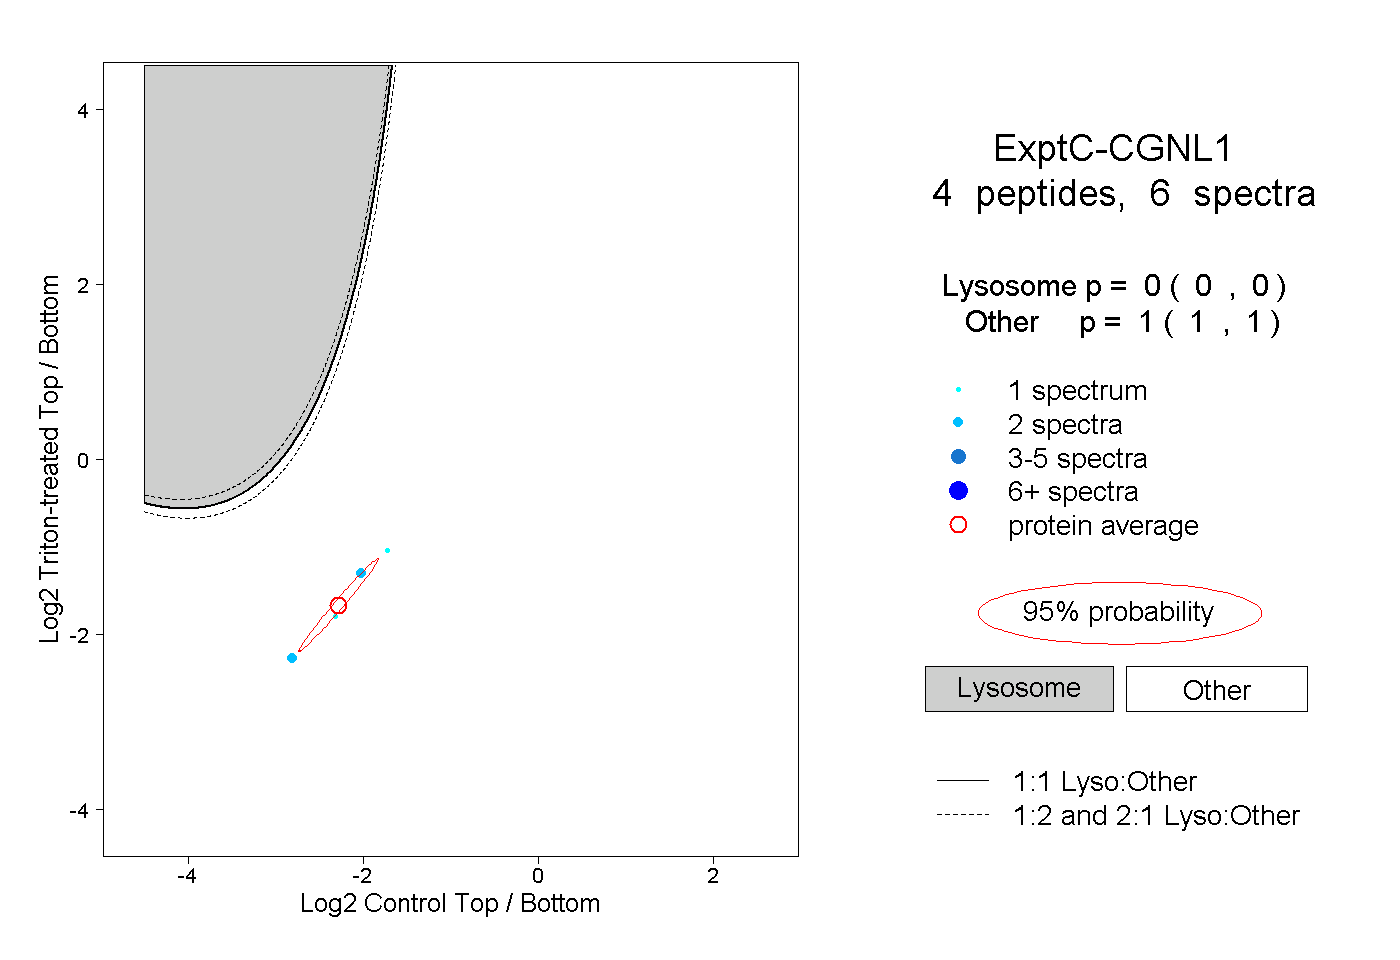
| Expt C |
4
peptides |
6
spectra |
 |
|
0.000
0.000 | 0.000 |
|
|
|
|
|
|
|
1.000
1.000 | 1.000 |