 51
51peptides
spectra
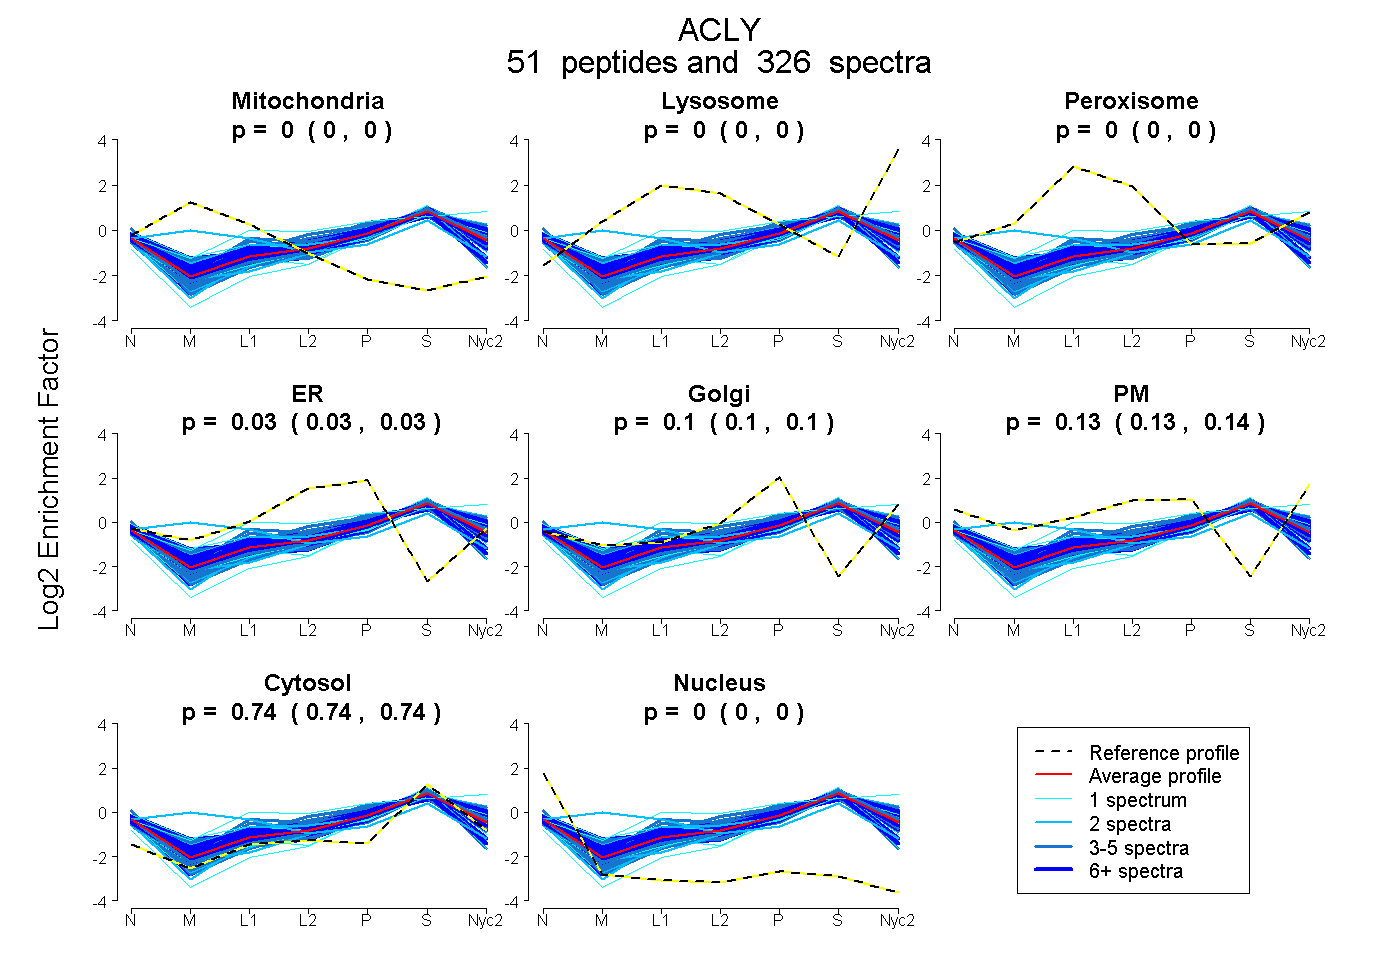
0.000 | 0.000
0.000 | 0.000
0.000 | 0.000
0.026 | 0.031
0.098 | 0.102
0.132 | 0.136
0.736 | 0.737
0.000 | 0.000
35peptides
spectra
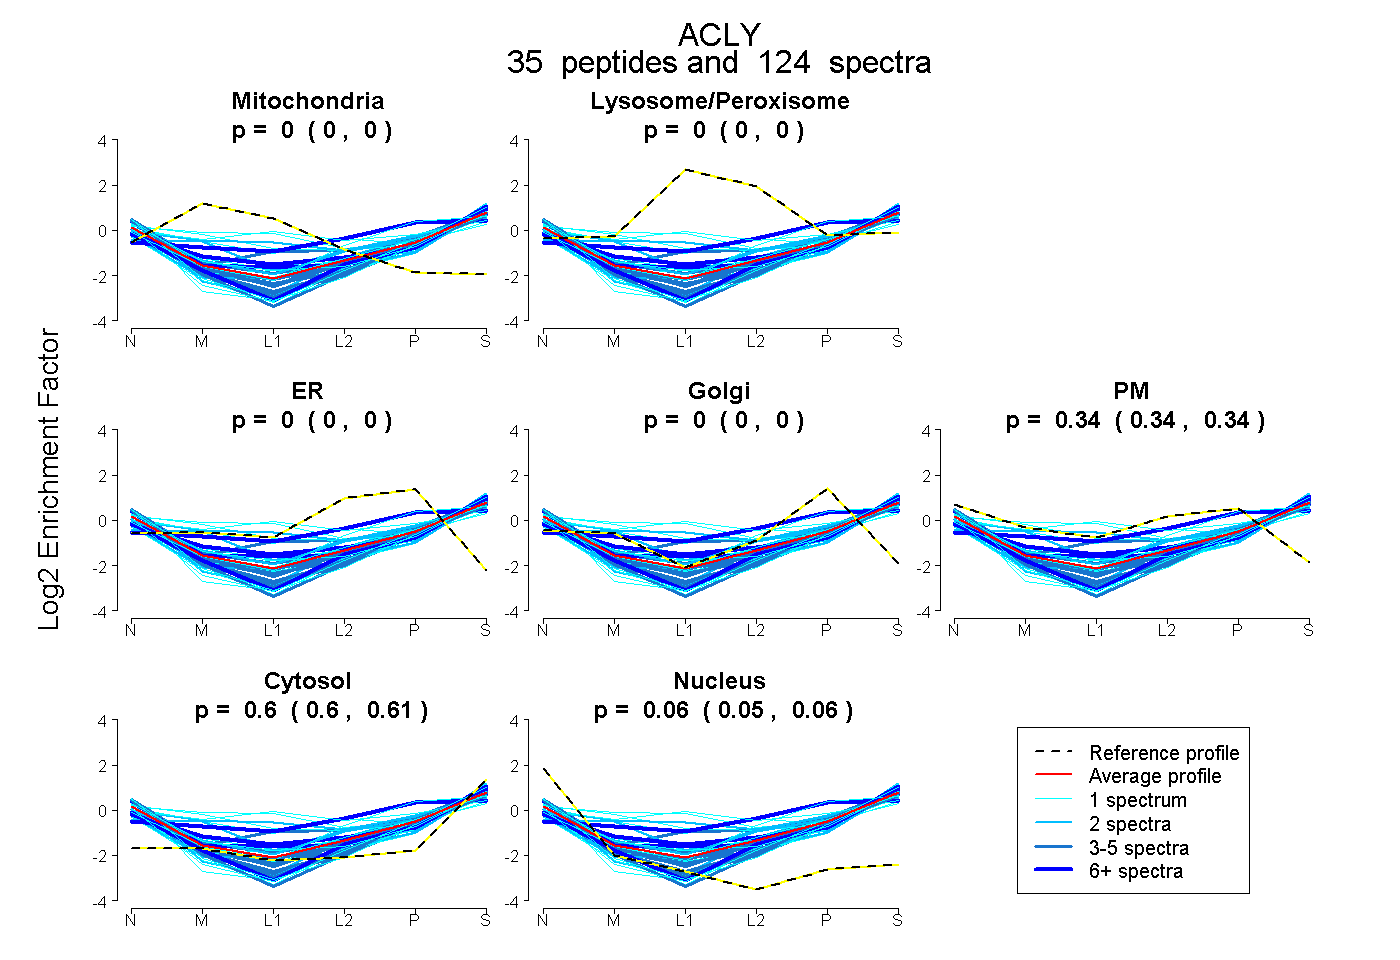
0.000 | 0.000
0.000 | 0.000
0.000 | 0.000
0.000 | 0.000
0.338 | 0.343
0.602 | 0.605
0.053 | 0.058
51peptides
spectra
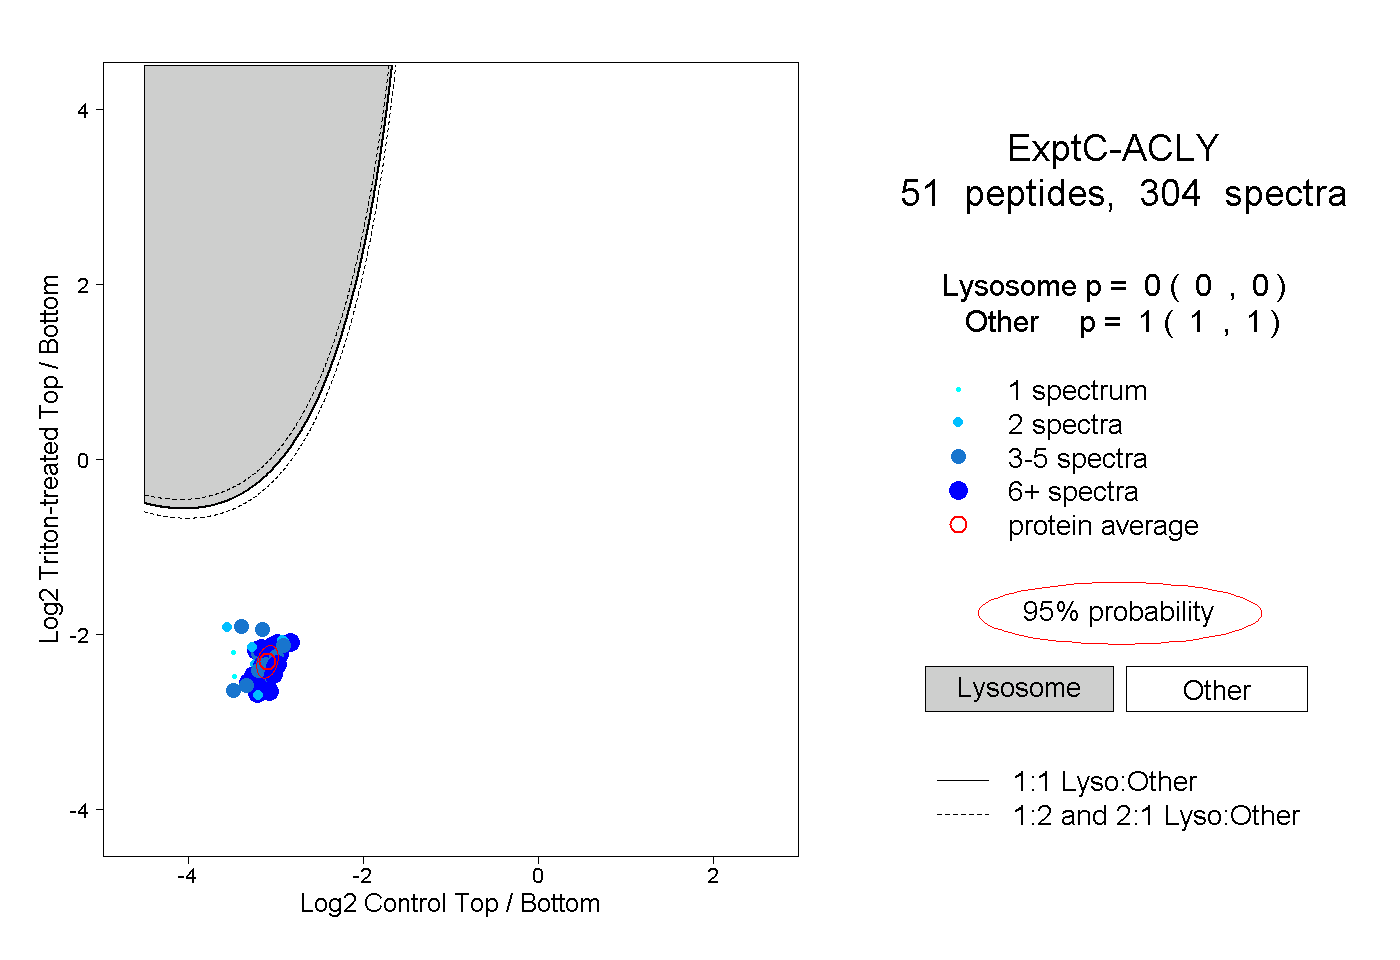
0.000 | 0.000
1.000 | 1.000
13peptides
spectra
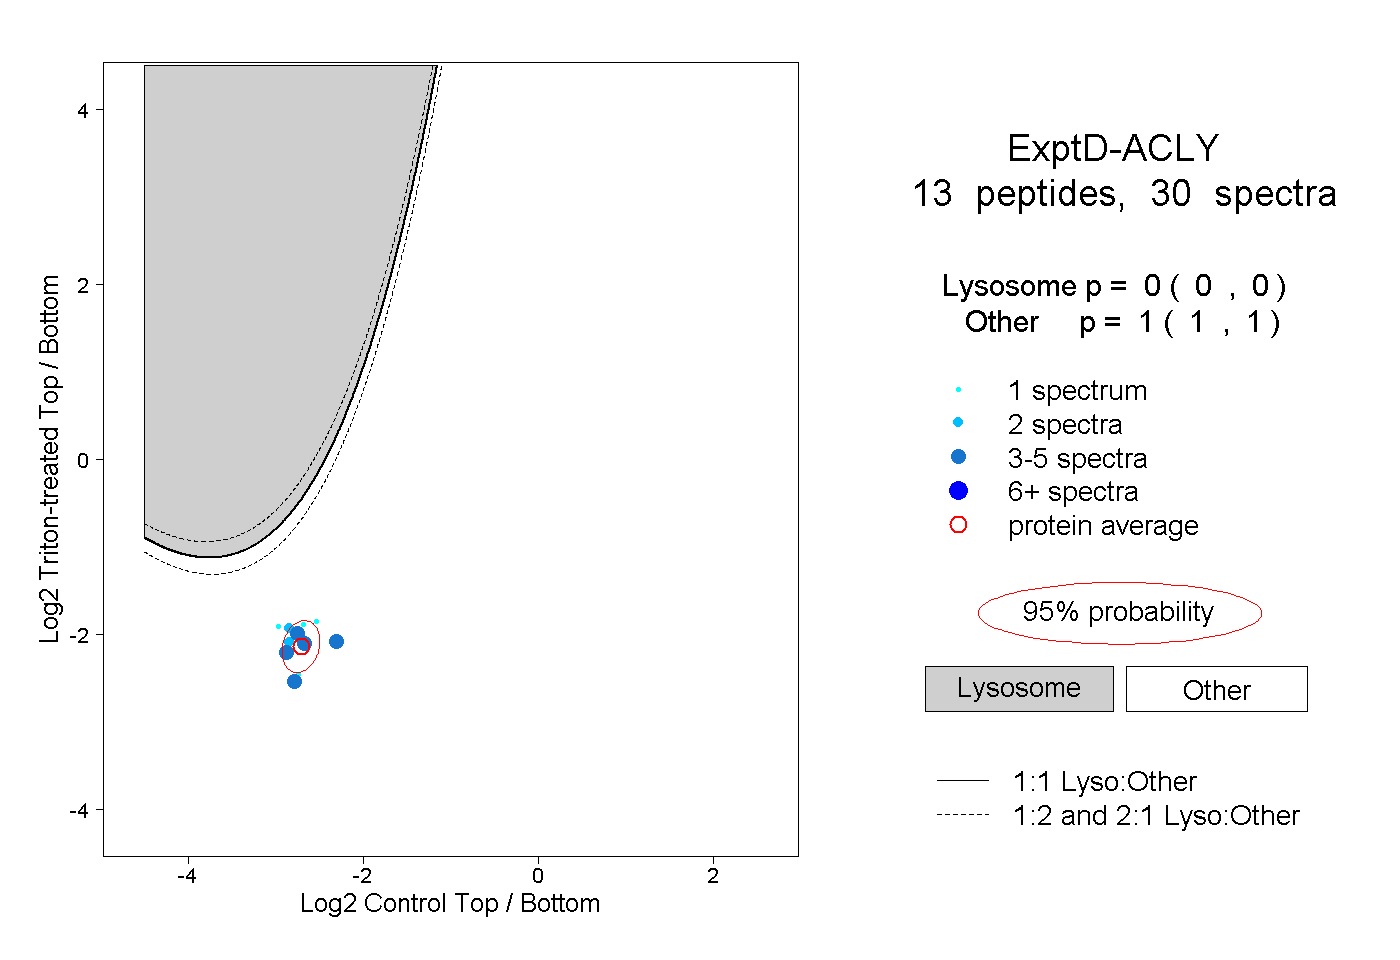
0.000 | 0.000
1.000 | 1.000