NUDT6
[ENSRNOP00000023437]
Main page
| | | Plot |
Mito |
Lyso |
|
Perox |
ER |
Golgi |
PM |
Cytosol |
Nucleus |
|
| Expt A |
 6
6
peptides |
10
spectra |
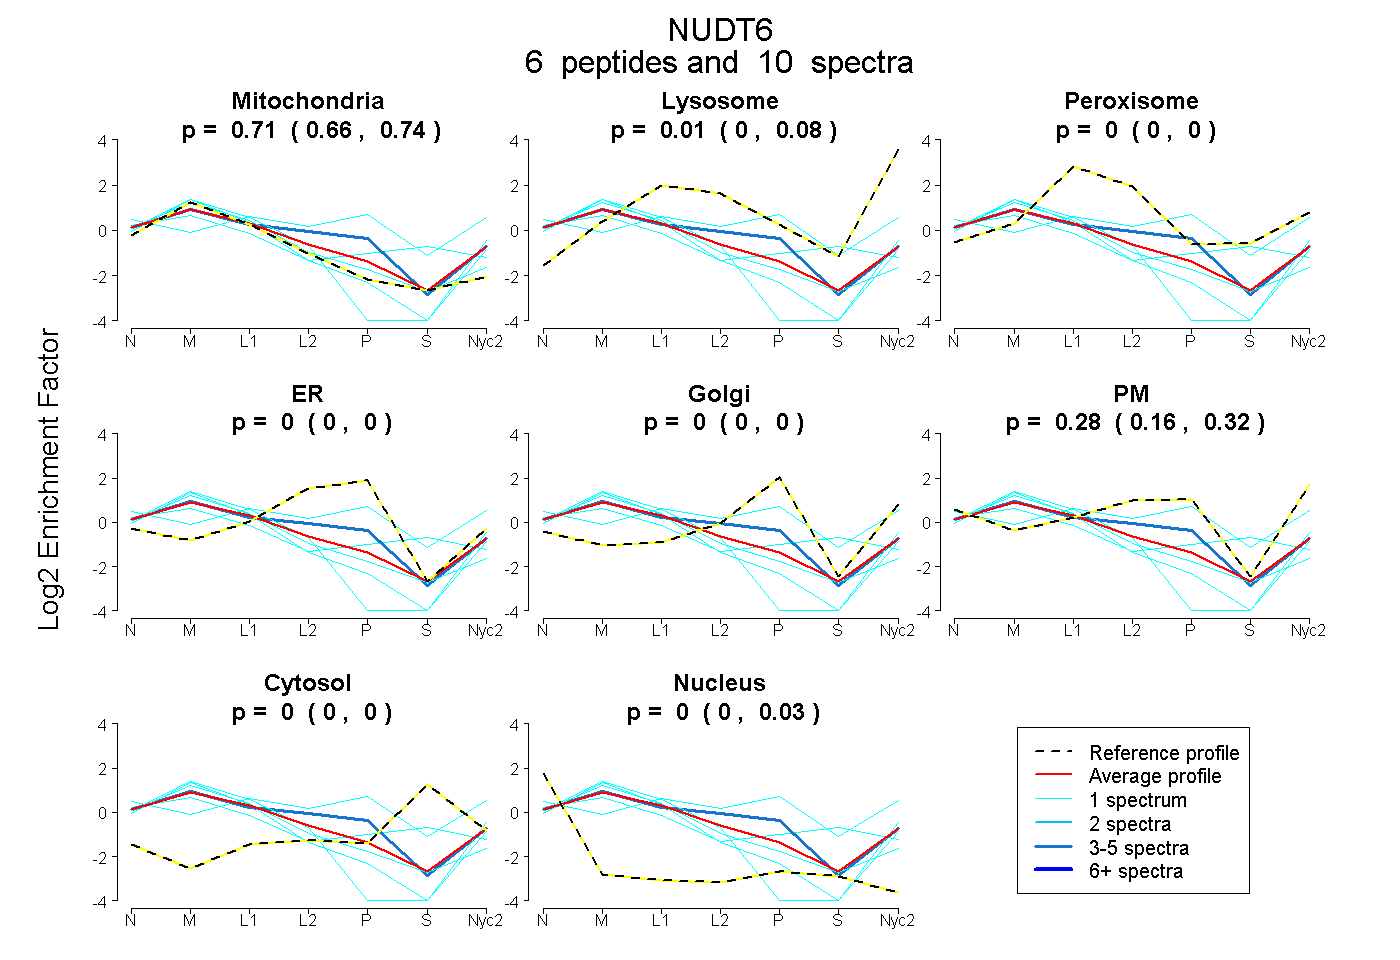 |
0.710
0.659 | 0.740 |
0.013
0.000 | 0.077 |
|
0.000
0.000 | 0.000 |
0.000
0.000 | 0.000 |
0.000
0.000 | 0.000 |
0.277
0.162 | 0.322 |
0.000
0.000 | 0.000 |
0.000
0.000 | 0.032 |
|
| | | Plot |
Mito |
|
Lyso or Perox |
|
ER |
Golgi |
PM |
Cytosol |
Nucleus |
|
| Expt B |
5
peptides |
8
spectra |
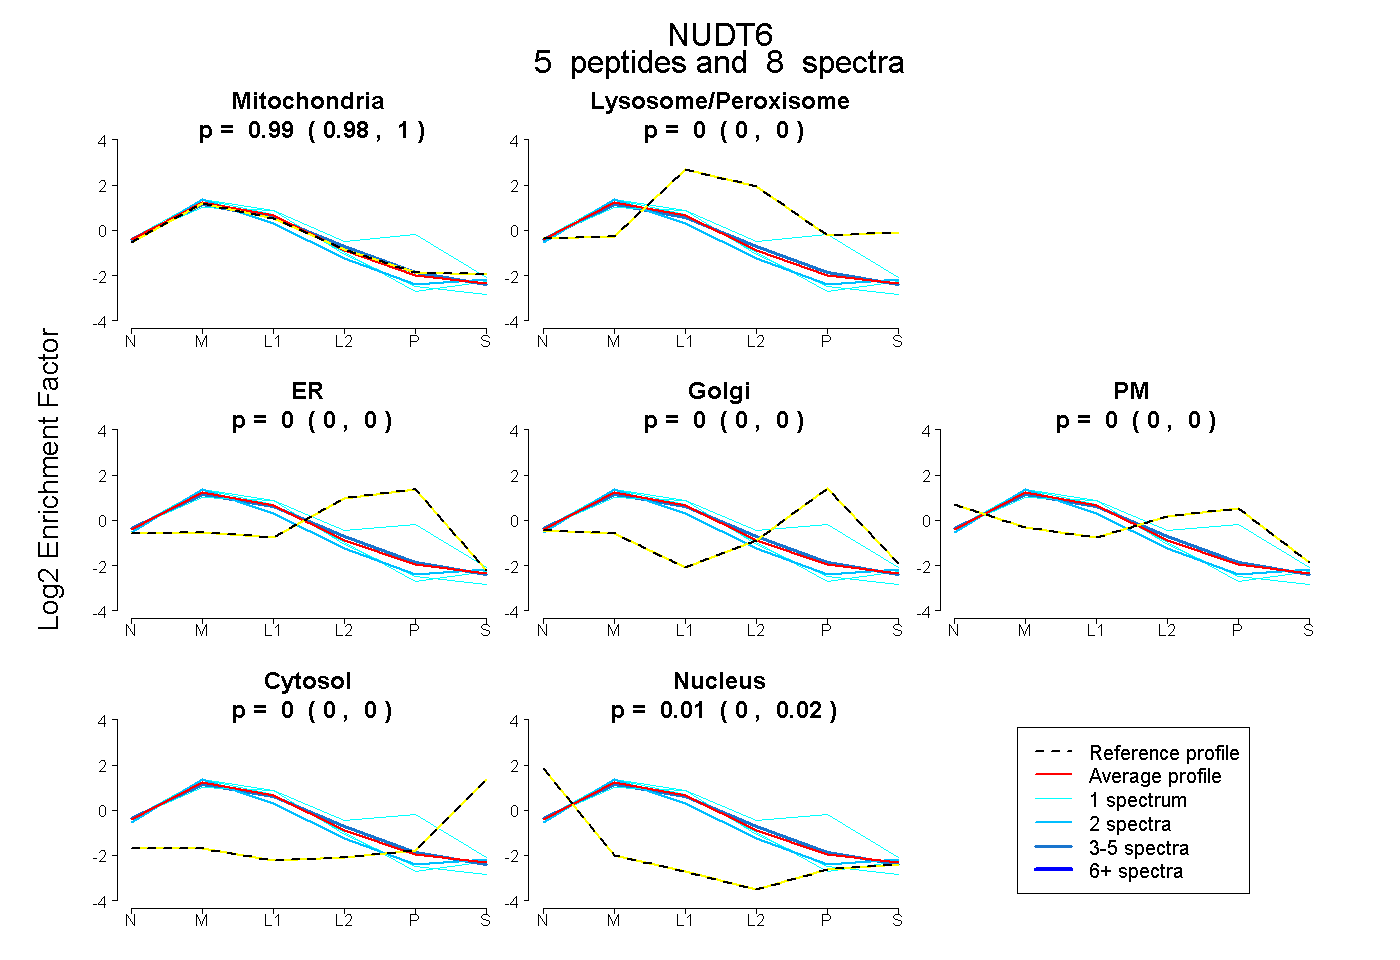 |
0.995
0.975 | 1.000 |
|
0.000
0.000 | 0.000 |
|
0.000
0.000 | 0.005 |
0.000
0.000 | 0.000 |
0.000
0.000 | 0.003 |
0.000
0.000 | 0.000 |
0.005
0.000 | 0.017 |
|
| 3 spectra, LLLYGHR |
0.977 |
|
0.000 |
|
0.017 |
0.000 |
0.002 |
0.000 |
0.004 |
|
| 1 spectrum, EVFEETGVK |
0.994 |
|
0.000 |
|
0.000 |
0.000 |
0.000 |
0.000 |
0.006 |
|
| 2 spectra, SLLSIR |
0.949 |
|
0.000 |
|
0.000 |
0.000 |
0.000 |
0.000 |
0.051 |
|
| 1 spectrum, VLVVQDR |
0.632 |
|
0.093 |
|
0.271 |
0.001 |
0.004 |
0.000 |
0.000 |
|
| 1 spectrum, LDAAAFR |
0.985 |
|
0.000 |
|
0.000 |
0.000 |
0.000 |
0.000 |
0.015 |
|
| | | Plot |
|
Lyso |
|
|
|
|
|
|
|
Other |
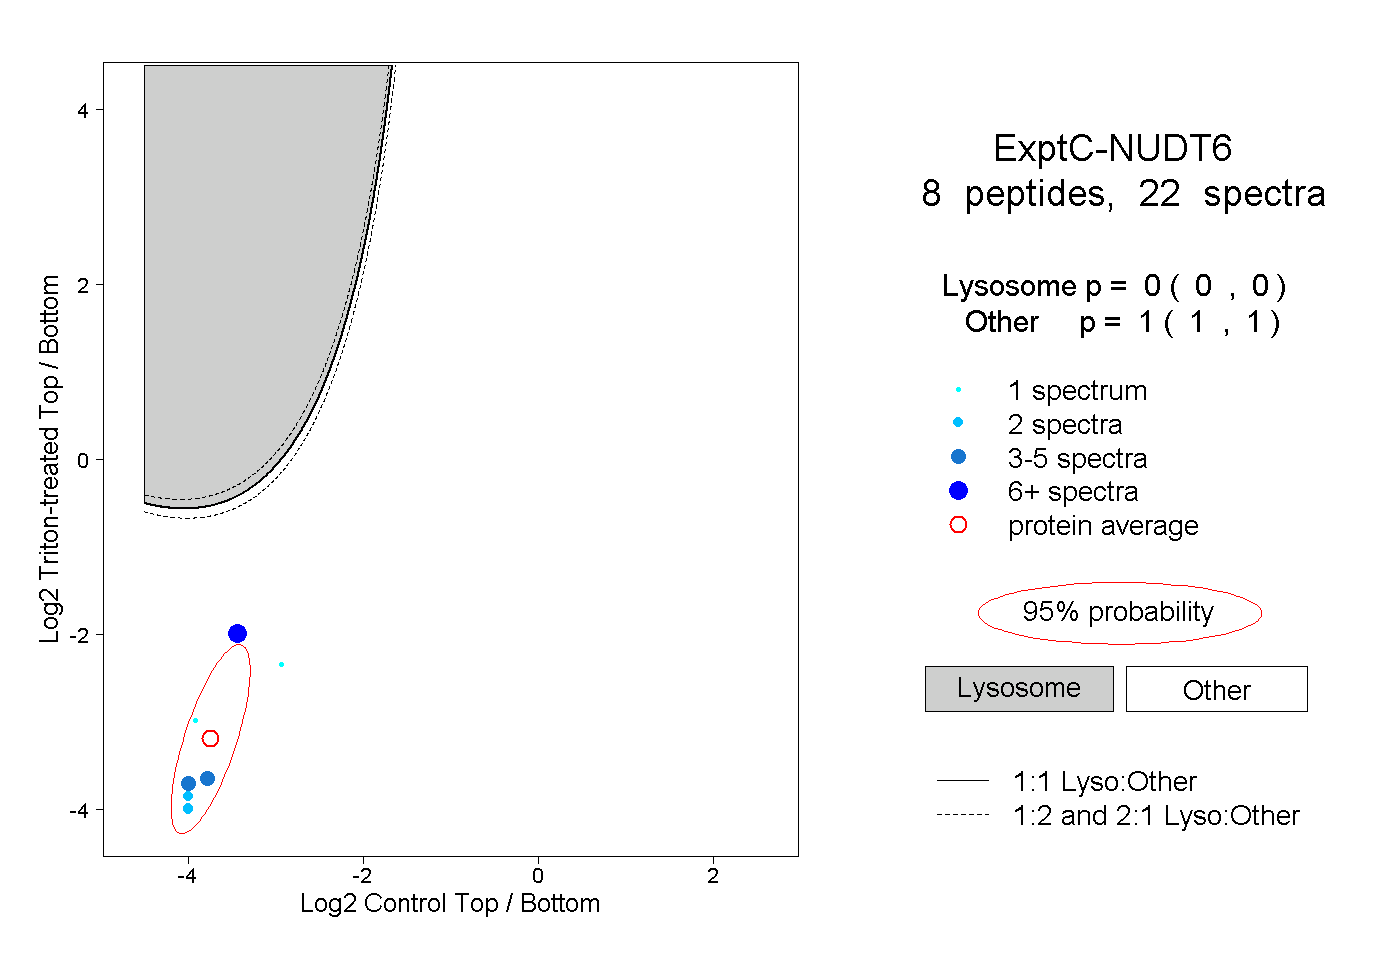
| Expt C |
8
peptides |
22
spectra |
 |
|
0.000
0.000 | 0.000 |
|
|
|
|
|
|
|
1.000
1.000 | 1.000 |
| | | Plot |
|
Lyso |
|
|
|
|
|
|
|
Other |
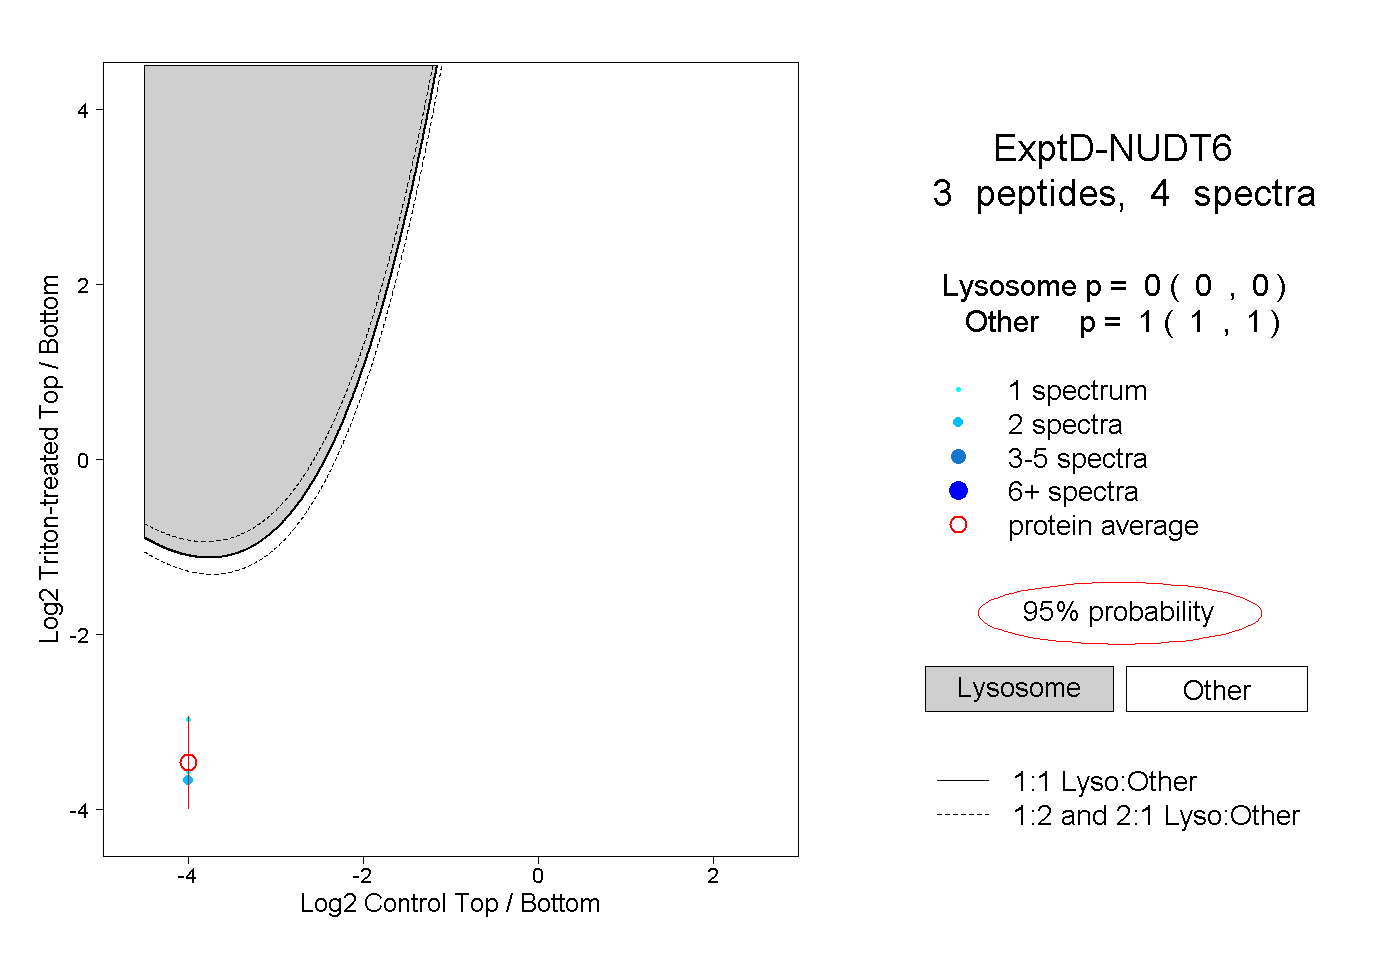
| Expt D |
3
peptides |
4
spectra |
 |
|
0.000
0.000 | 0.000 |
|
|
|
|
|
|
|
1.000
1.000 | 1.000 |