 33
33peptides
spectra
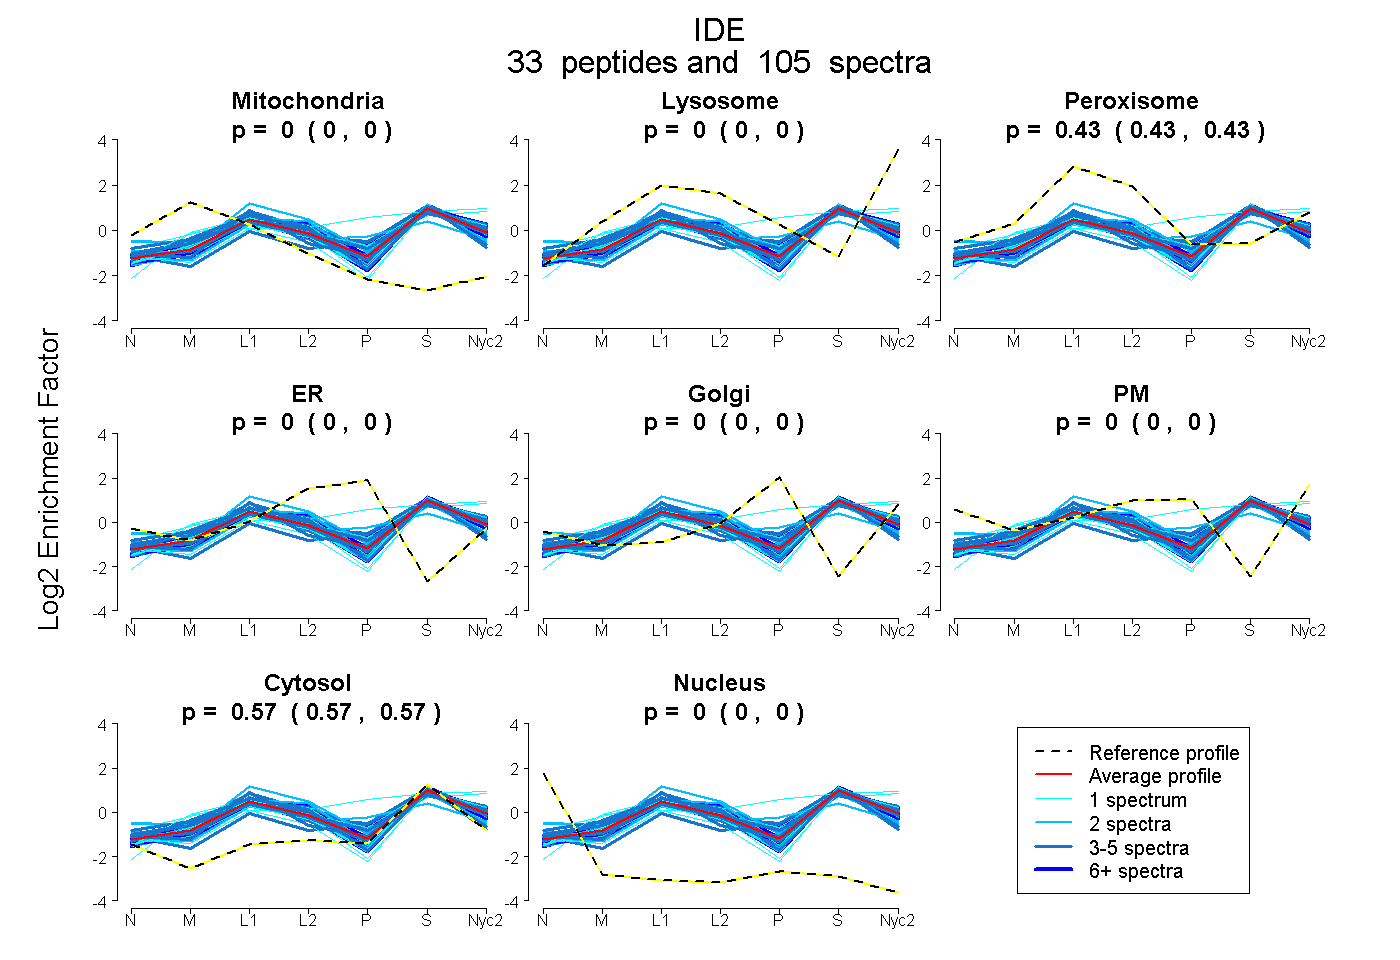
0.000 | 0.000
0.000 | 0.003
0.426 | 0.431
0.000 | 0.000
0.000 | 0.000
0.000 | 0.000
0.569 | 0.571
0.000 | 0.000
17peptides
spectra
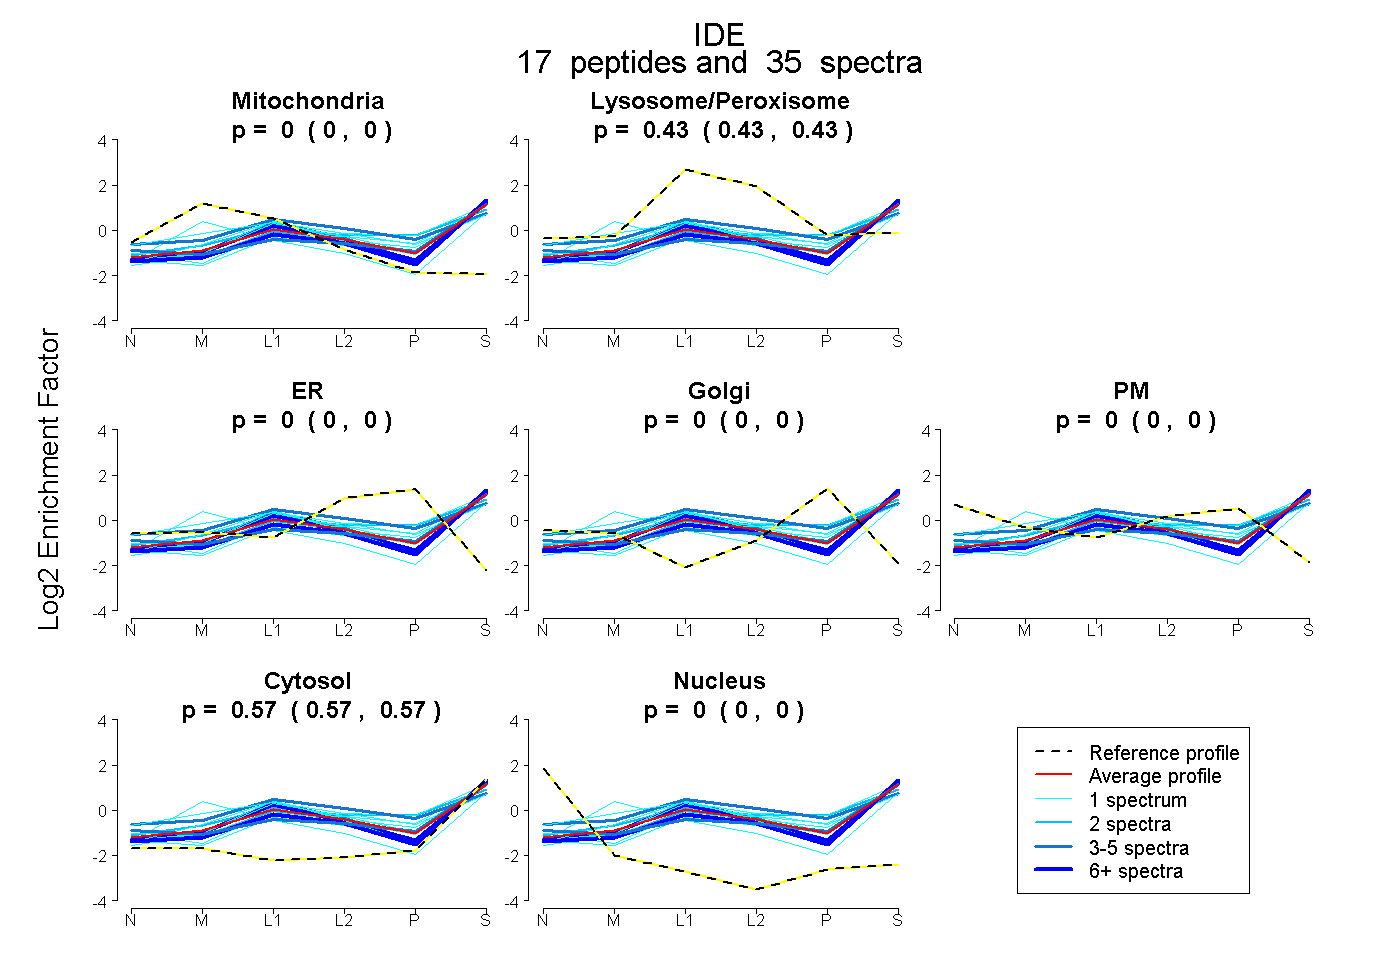
0.000 | 0.000
0.427 | 0.434
0.000 | 0.000
0.000 | 0.000
0.000 | 0.000
0.566 | 0.572
0.000 | 0.000
38peptides
spectra
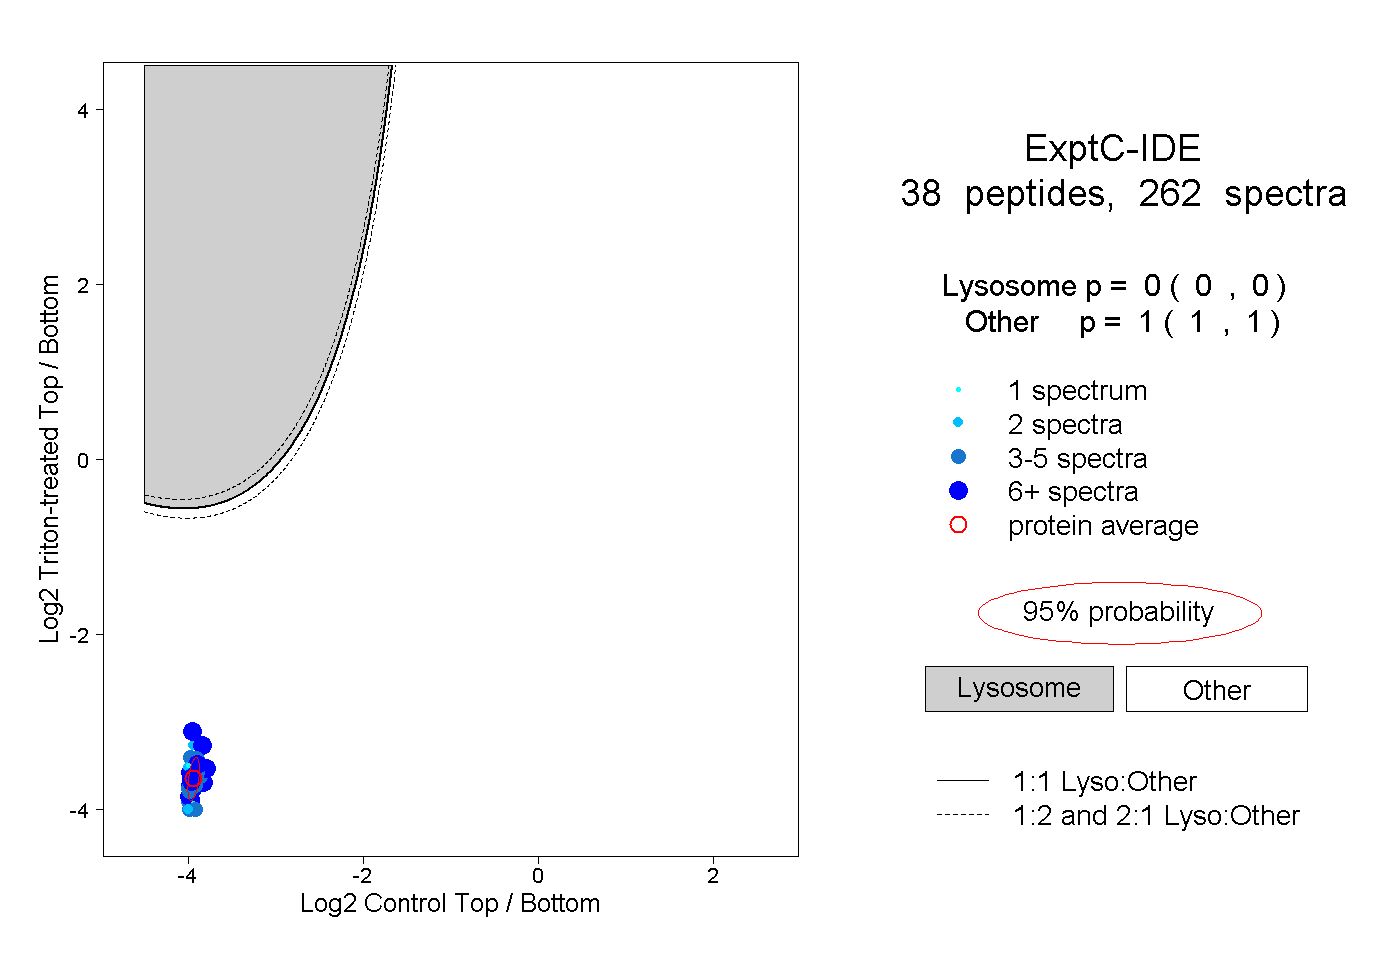
0.000 | 0.000
1.000 | 1.000
18peptides
spectra
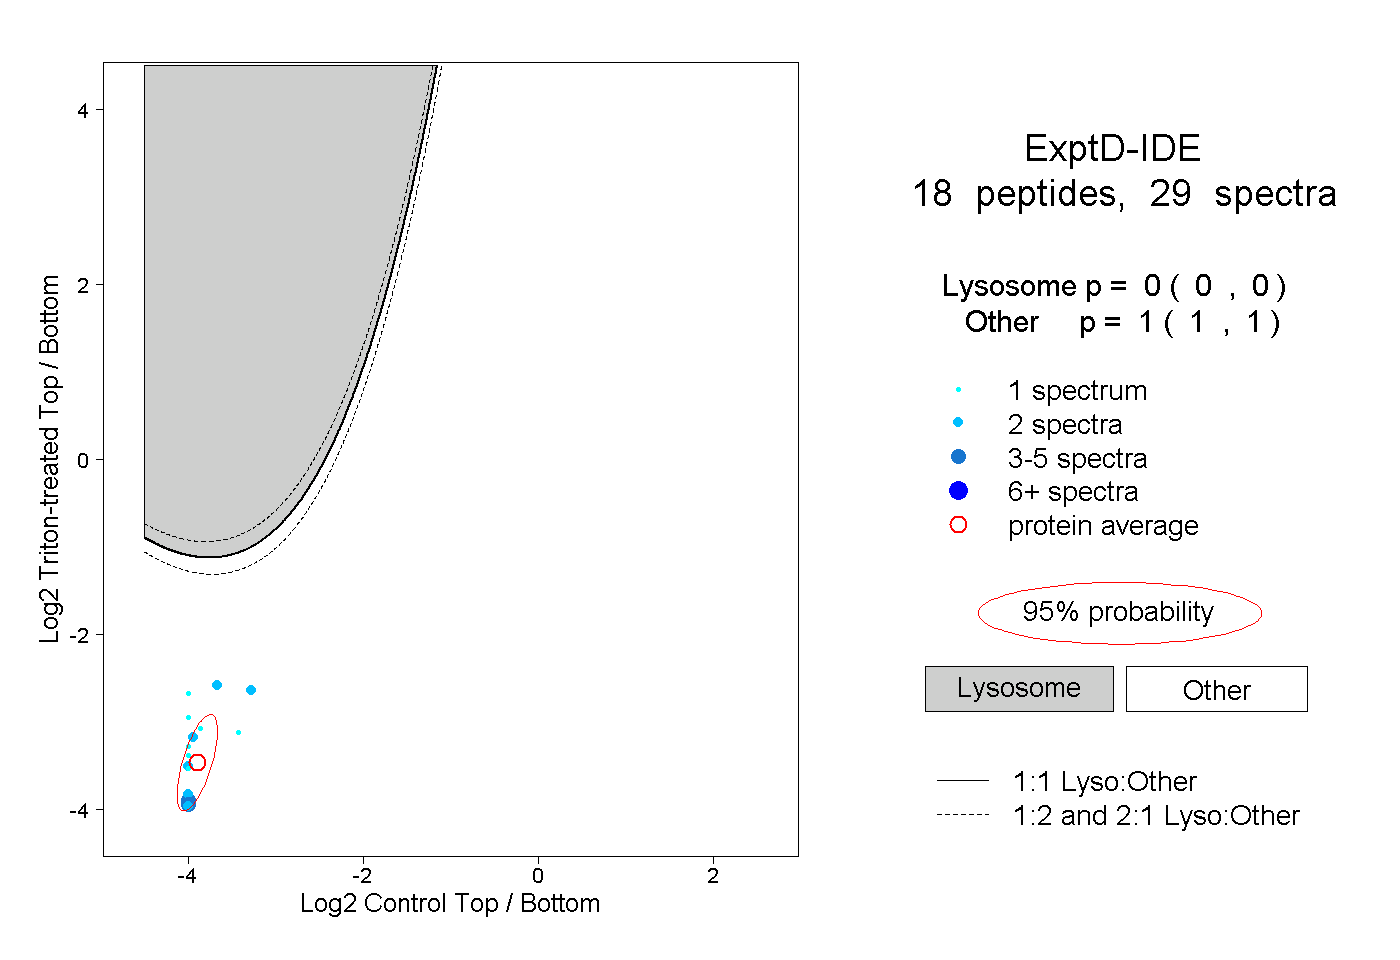
0.000 | 0.000
1.000 | 1.000