 3
3peptides
spectra
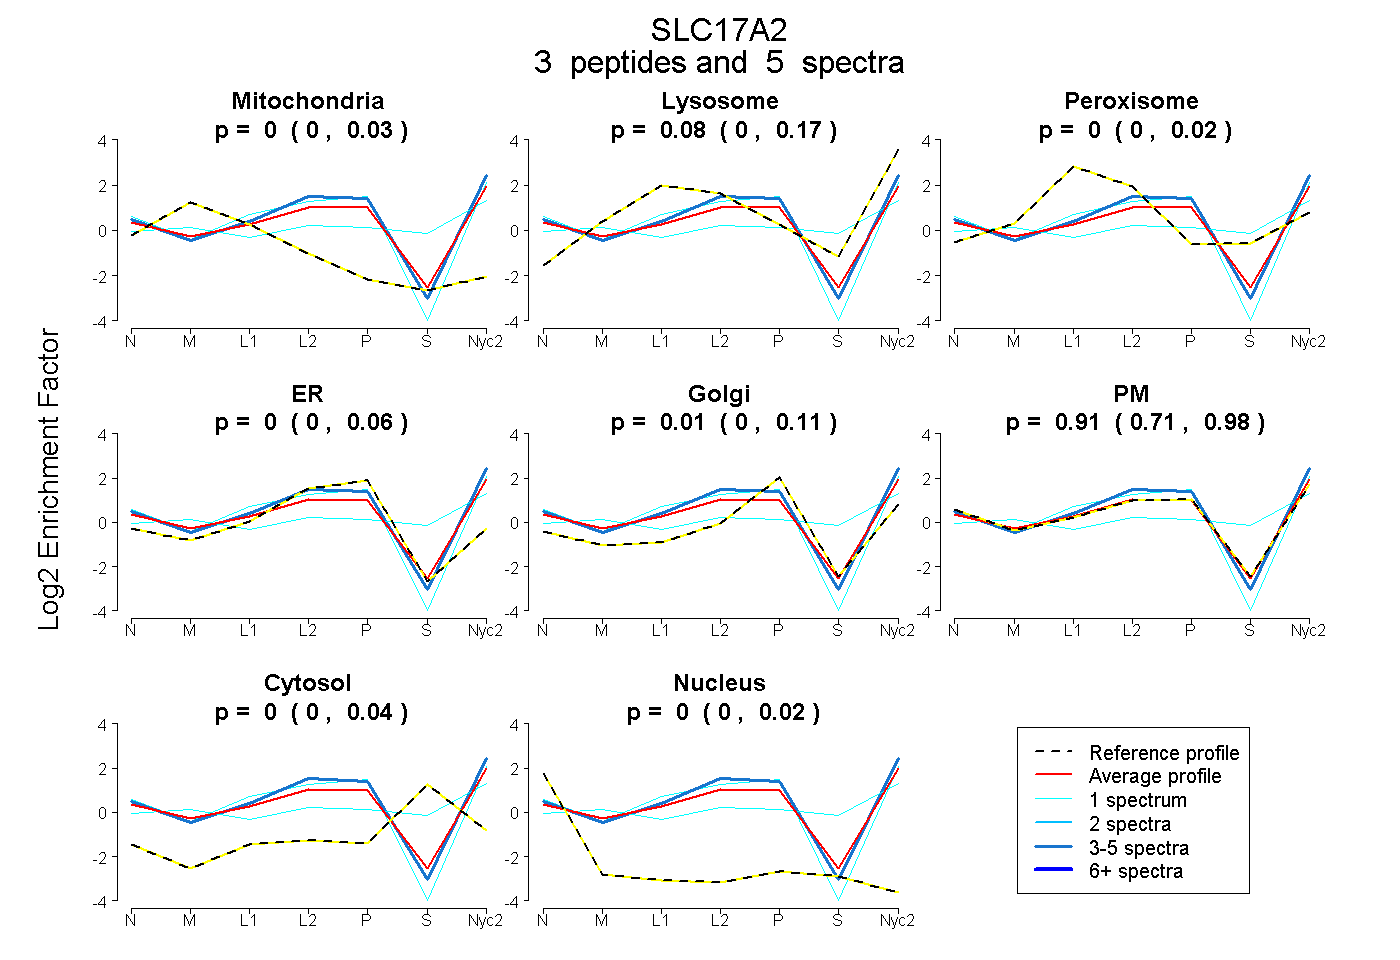
0.000 | 0.027
0.000 | 0.168
0.000 | 0.024
0.000 | 0.063
0.000 | 0.111
0.707 | 0.976
0.000 | 0.040
0.000 | 0.018
1peptide
spectra
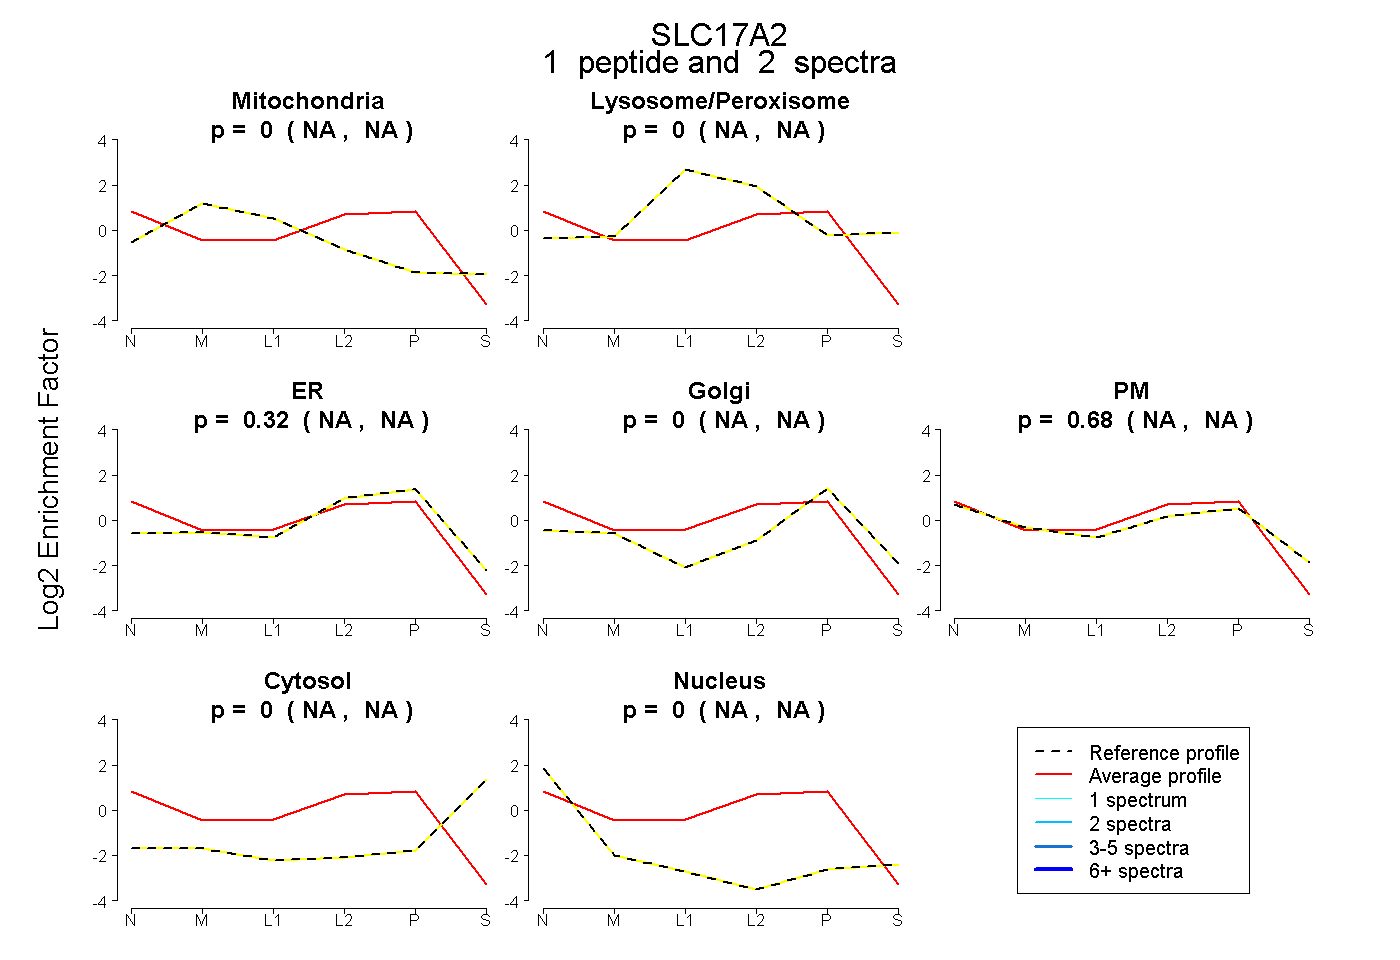
NA | NA
NA | NA
NA | NA
NA | NA
NA | NA
NA | NA
NA | NA
2peptides
spectra
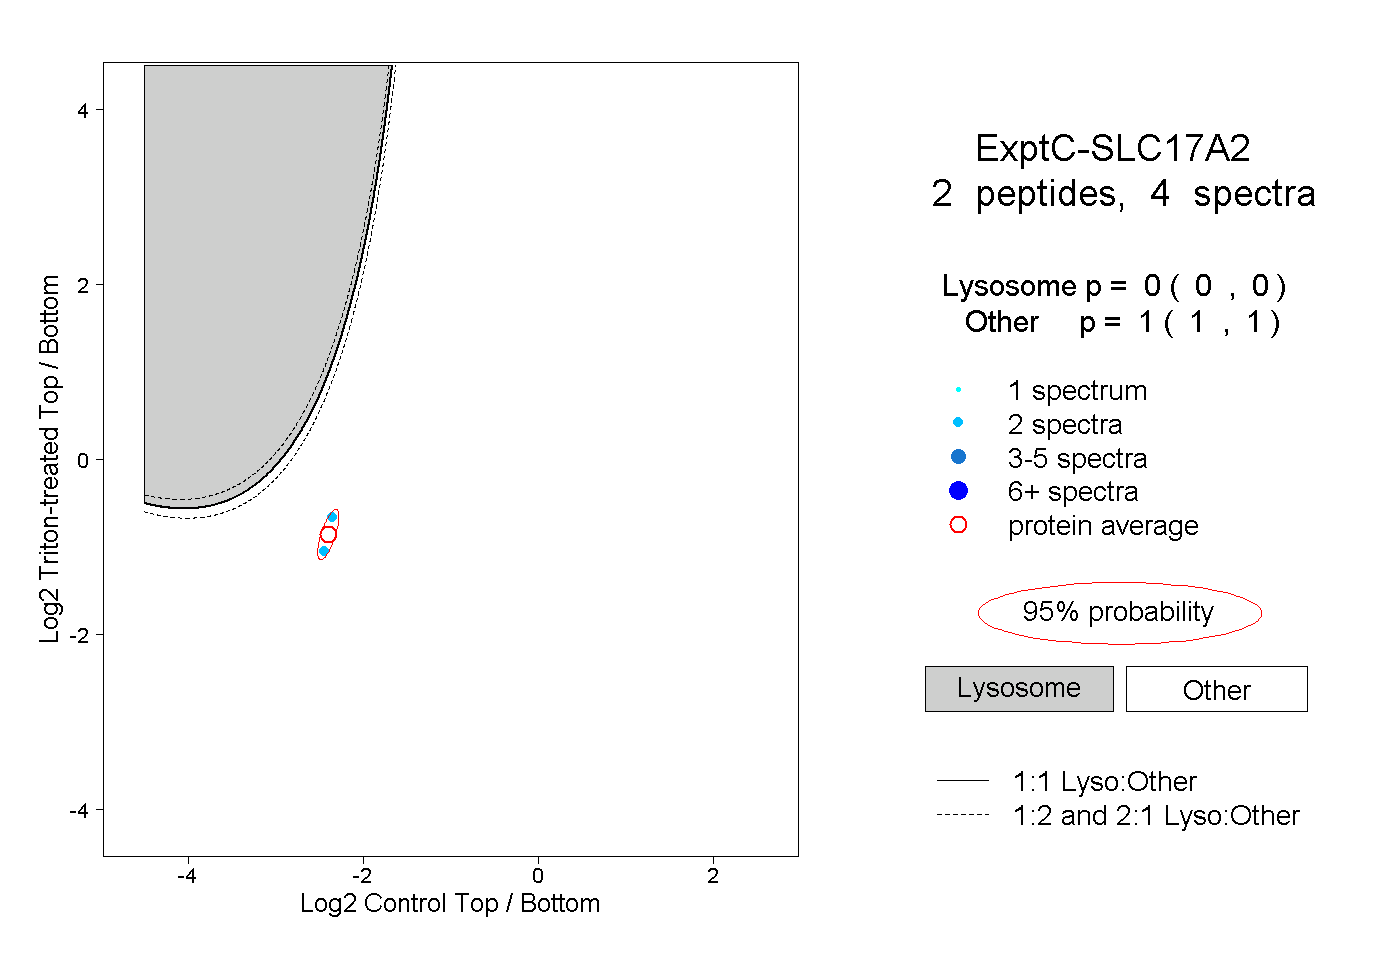
0.000 | 0.000
1.000 | 1.000