 3
3peptides
spectra

0.000 | 0.000
0.561 | 0.658
0.000 | 0.000
0.000 | 0.000
0.038 | 0.175
0.174 | 0.349
0.000 | 0.000
0.000 | 0.000
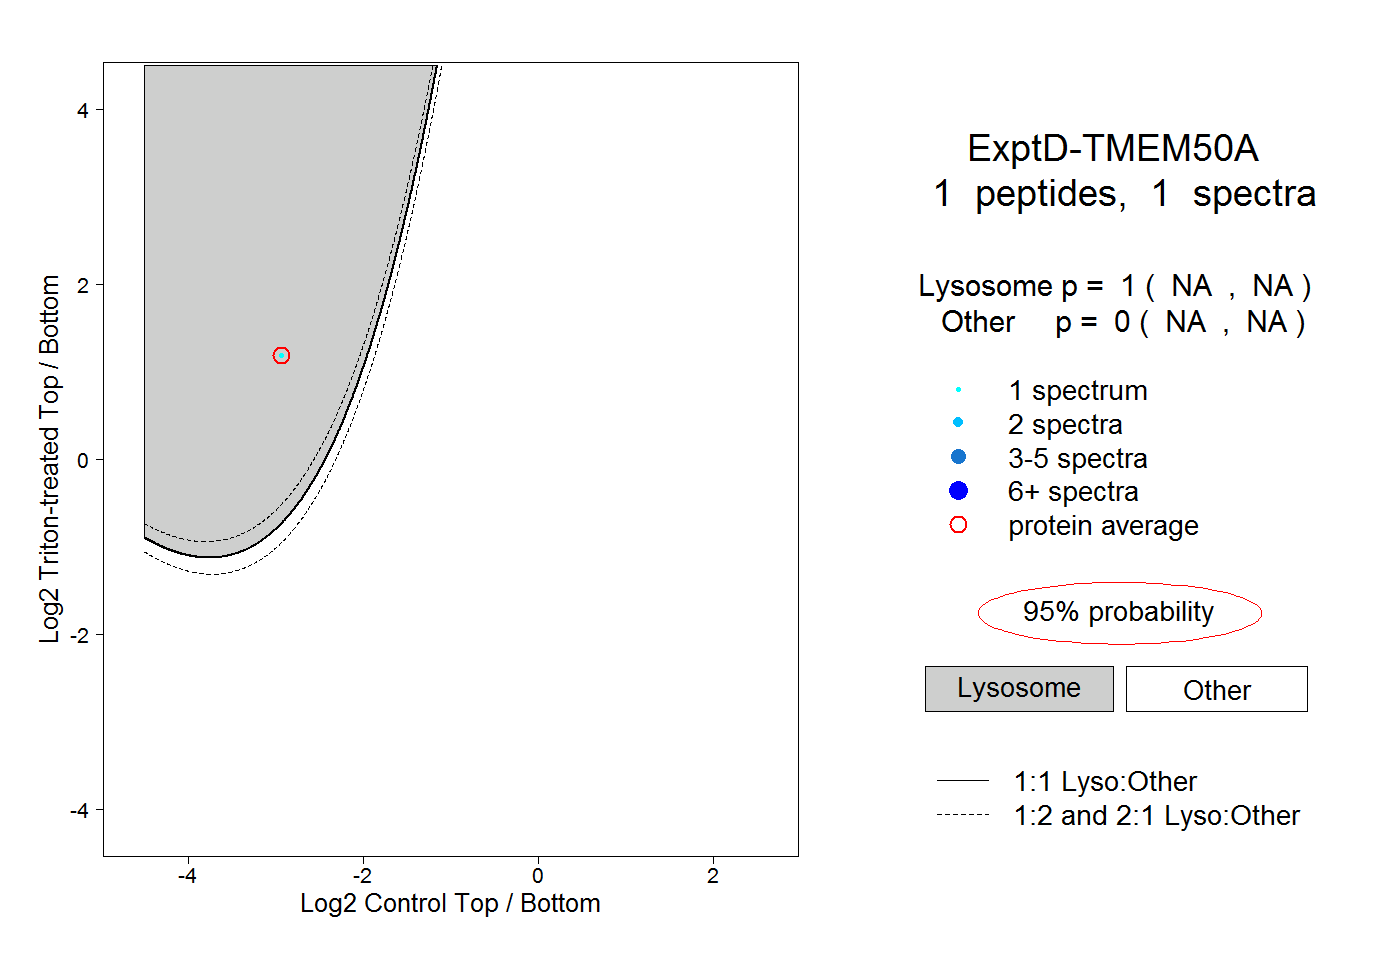
1peptide
spectrum

NA | NA
NA | NA
1peptide
spectrum
NA | NA
NA | NA