 8
8peptides
spectra
0.000 | 0.000
0.078 | 0.109
0.000 | 0.000
0.000 | 0.000
0.000 | 0.006
0.000 | 0.007
0.889 | 0.914
0.000 | 0.000
| Plot | Mito | Lyso | Perox | ER | Golgi | PM | Cytosol | Nucleus | |||||
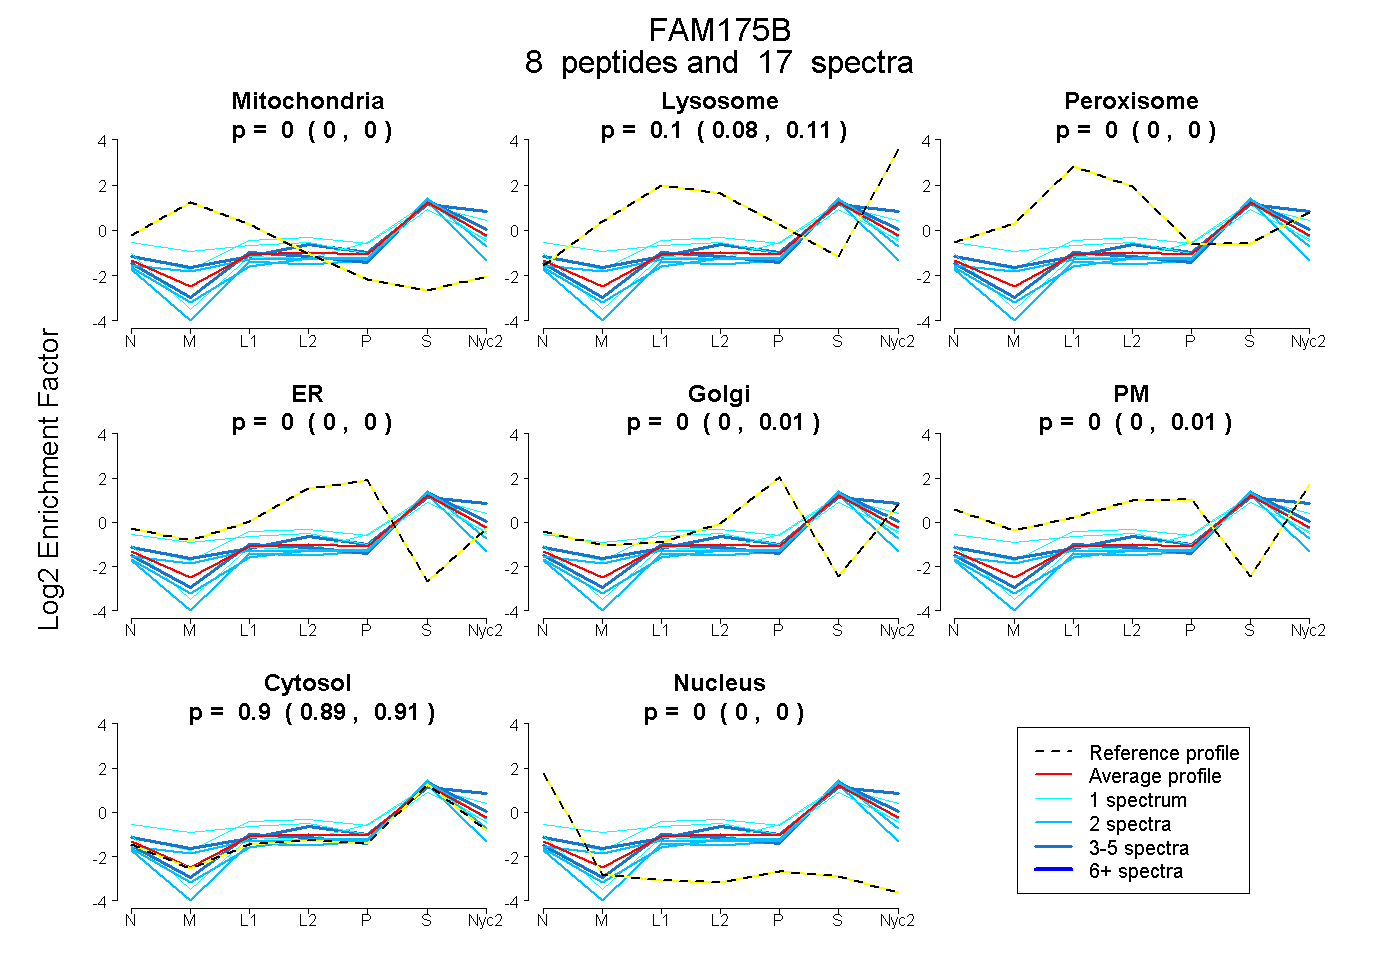
| Expt A |
8 peptides |
17 spectra |
|
0.000 0.000 | 0.000 |
0.096 0.078 | 0.109 |
0.000 0.000 | 0.000 |
0.000 0.000 | 0.000 |
0.000 0.000 | 0.006 |
0.000 0.000 | 0.007 |
0.904 0.889 | 0.914 |
0.000 0.000 | 0.000 |
| 1 spectrum, VSSVPNTSQSYAK | 0.081 | 0.000 | 0.187 | 0.000 | 0.000 | 0.074 | 0.657 | 0.000 | ||
| 1 spectrum, QMPSESLEPAFSPR | 0.000 | 0.000 | 0.000 | 0.000 | 0.084 | 0.000 | 0.916 | 0.000 | ||
| 2 spectra, MPYSGFSAEGR | 0.000 | 0.000 | 0.000 | 0.000 | 0.000 | 0.000 | 1.000 | 0.000 | ||
| 4 spectra, VIGWYR | 0.000 | 0.077 | 0.000 | 0.000 | 0.000 | 0.000 | 0.923 | 0.000 | ||
| 2 spectra, VNEESLDR | 0.000 | 0.001 | 0.000 | 0.000 | 0.000 | 0.000 | 0.999 | 0.000 | ||
| 1 spectrum, LQQALLSR | 0.000 | 0.246 | 0.039 | 0.000 | 0.000 | 0.000 | 0.715 | 0.000 | ||
| 2 spectra, VQAVCADVEK | 0.092 | 0.000 | 0.000 | 0.000 | 0.000 | 0.000 | 0.908 | 0.000 | ||
| 4 spectra, NTQQQMSYR | 0.000 | 0.244 | 0.000 | 0.000 | 0.000 | 0.000 | 0.756 | 0.000 |
| Plot | Mito | Lyso or Perox | ER | Golgi | PM | Cytosol | Nucleus | ||||||
| Expt B |
4 peptides |
6 spectra |
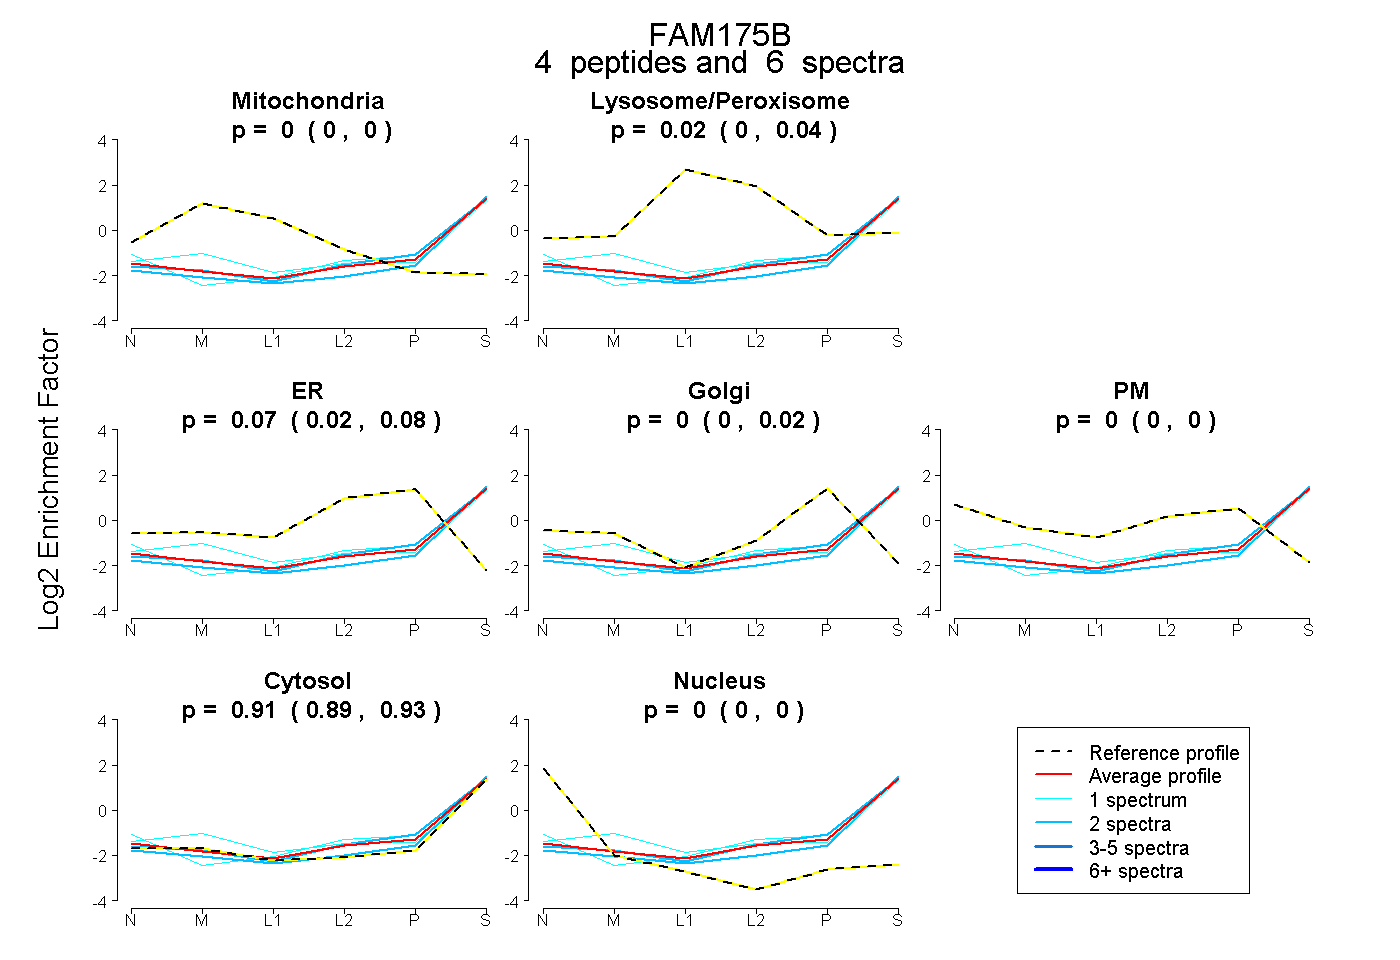 |
0.000 0.000 | 0.000 |
0.024 0.004 | 0.041 |
0.065 0.020 | 0.079 |
0.000 0.000 | 0.020 |
0.000 0.000 | 0.000 |
0.911 0.891 | 0.926 |
0.000 0.000 | 0.000 |
|||
| Plot | Lyso | Other | |||||||||||
| Expt C |
6 peptides |
14 spectra |
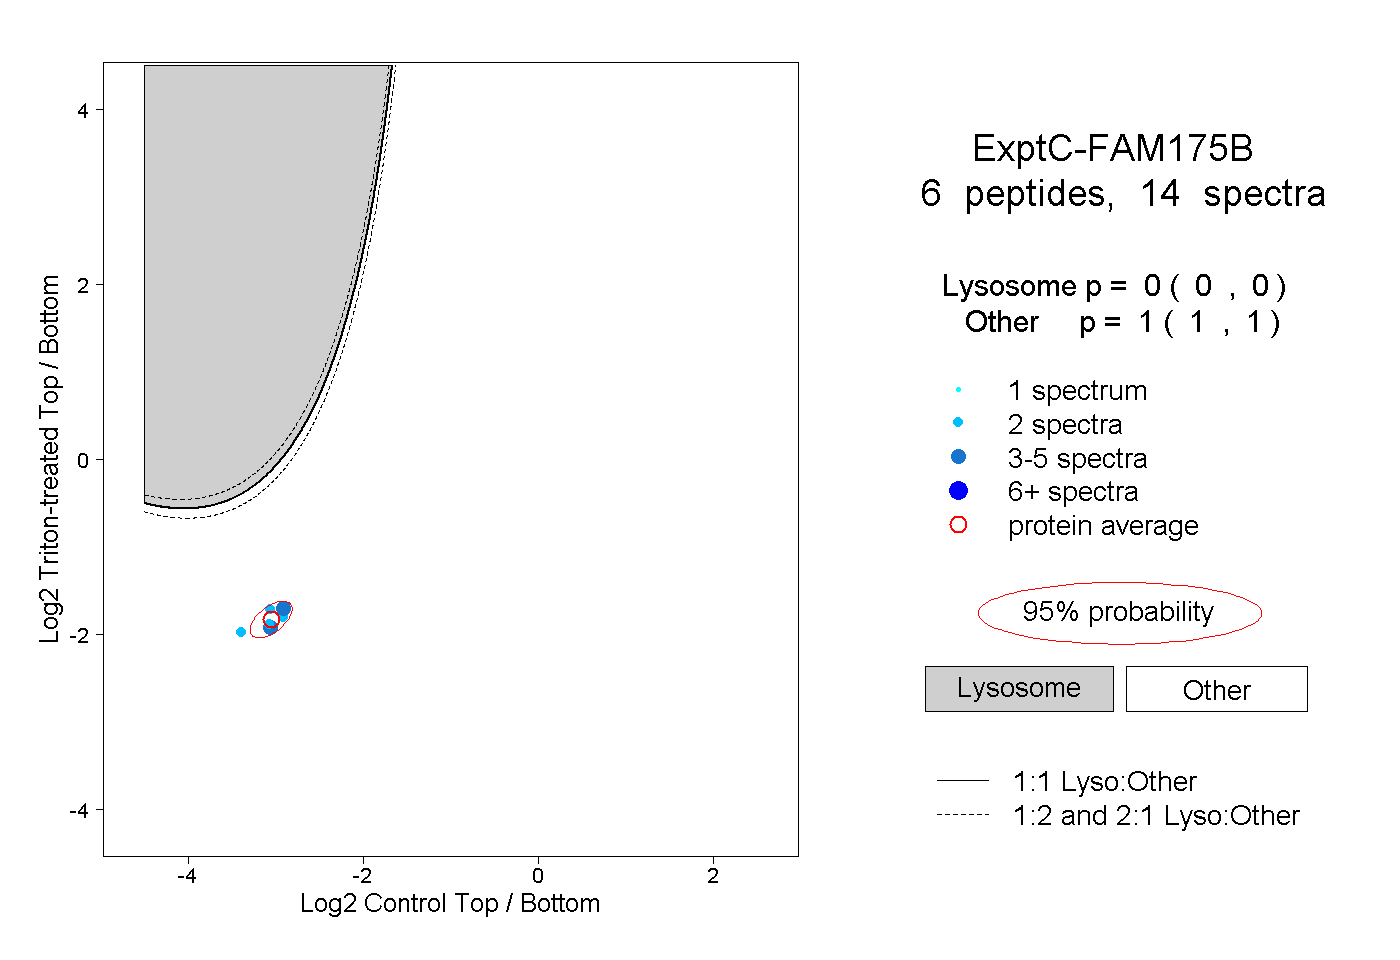 |
0.000 0.000 | 0.000 |
1.000 1.000 | 1.000 |
||||||||
| Plot | Lyso | Other | |||||||||||
| Expt D |
1 peptide |
2 spectra |
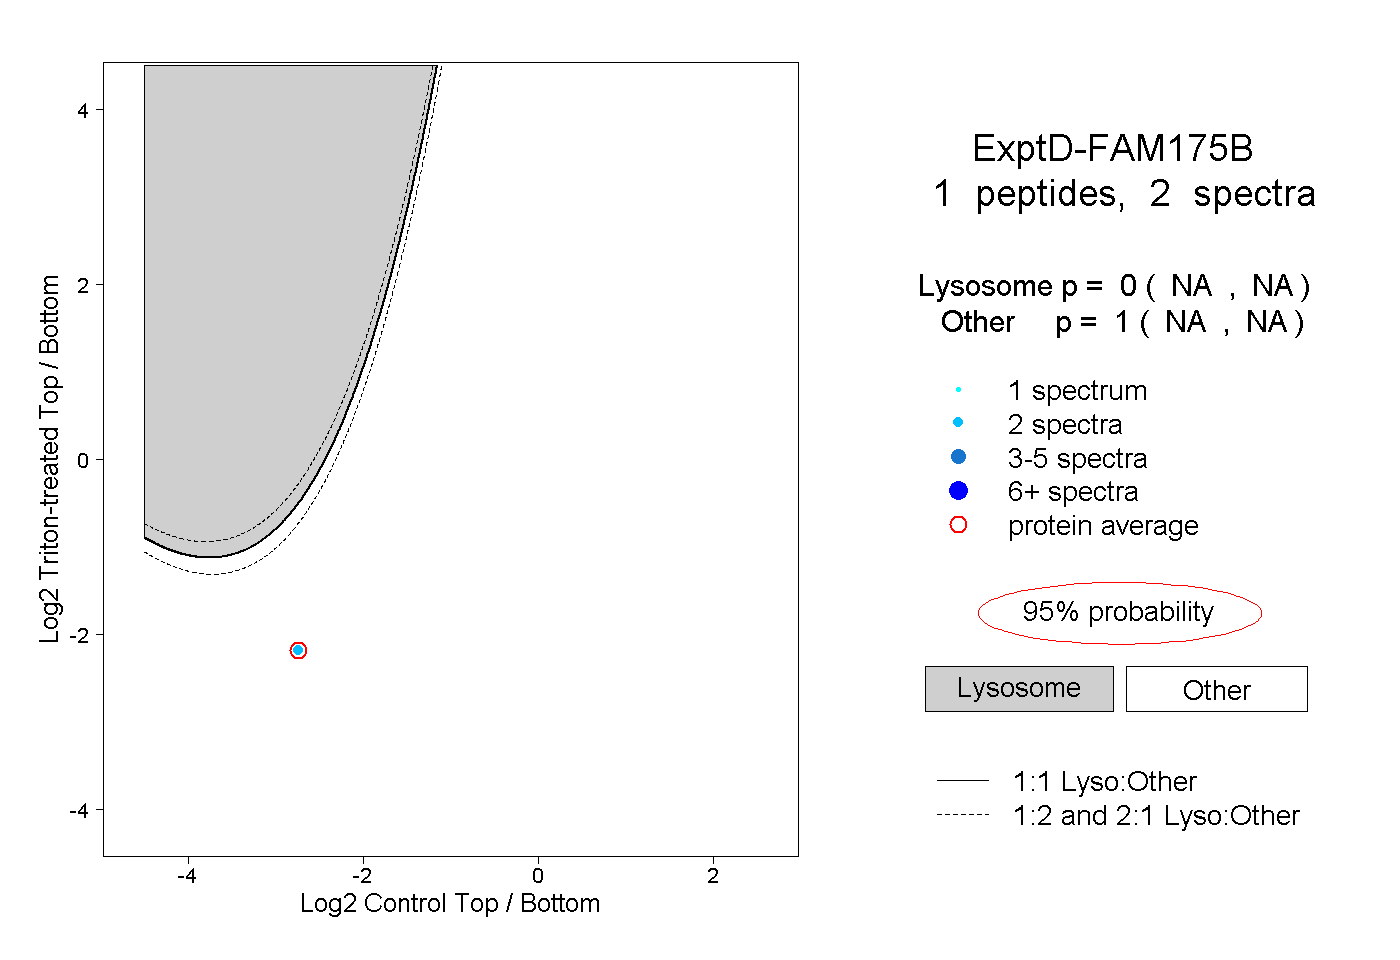 |
0.000 NA | NA |
1.000 NA | NA |