 10
10peptides
spectra
0.000 | 0.000
0.002 | 0.039
0.060 | 0.093
0.000 | 0.000
0.000 | 0.000
0.344 | 0.356
0.545 | 0.553
0.000 | 0.000
| Plot | Mito | Lyso | Perox | ER | Golgi | PM | Cytosol | Nucleus | |||||
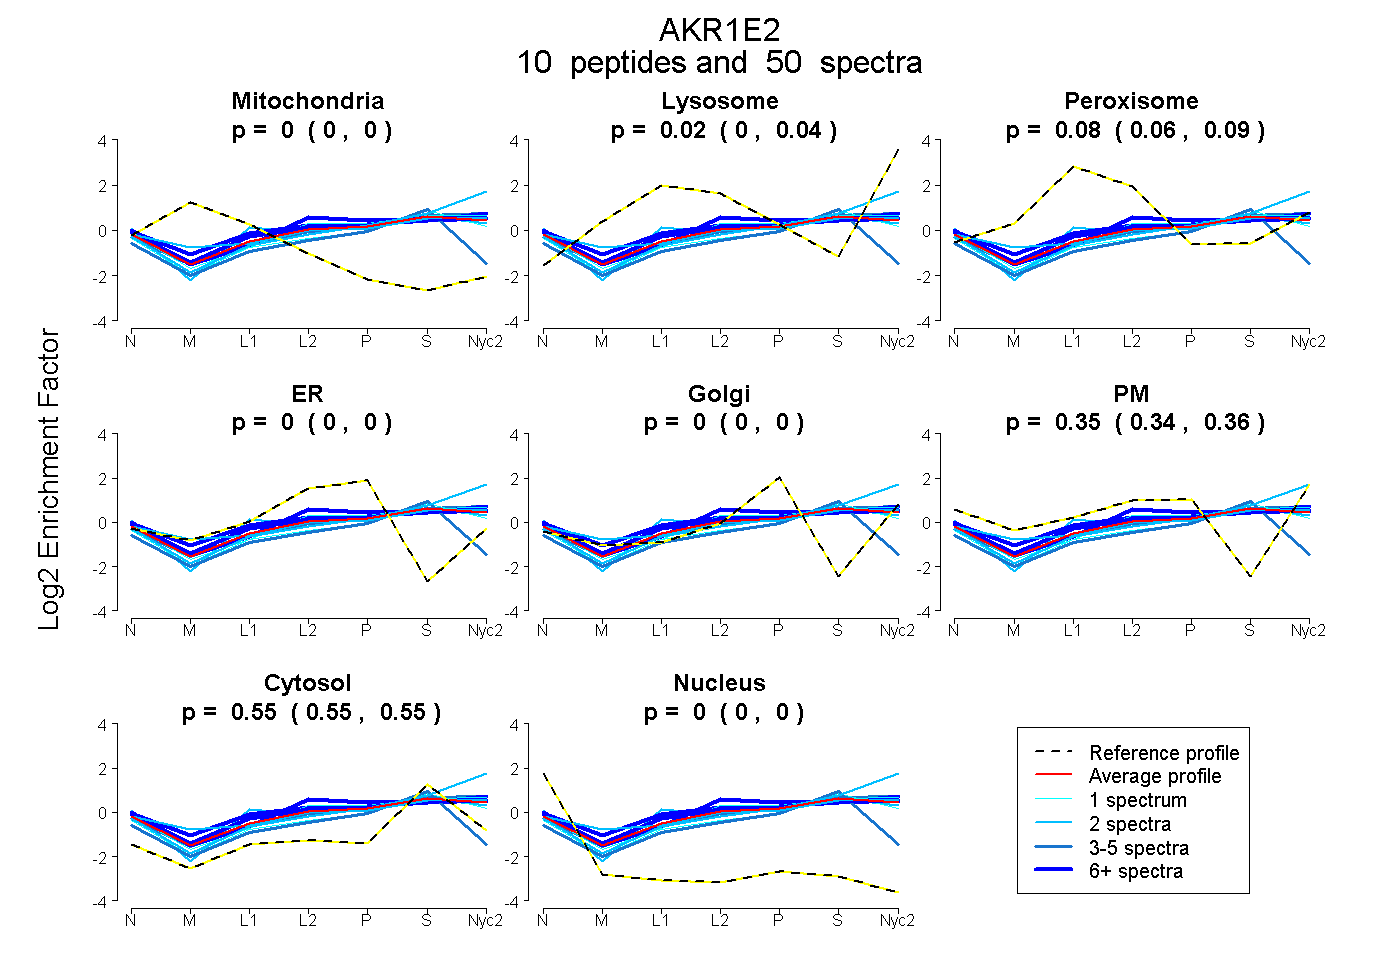
| Expt A |
10 peptides |
50 spectra |
|
0.000 0.000 | 0.000 |
0.022 0.002 | 0.039 |
0.078 0.060 | 0.093 |
0.000 0.000 | 0.000 |
0.000 0.000 | 0.000 |
0.351 0.344 | 0.356 |
0.549 0.545 | 0.553 |
0.000 0.000 | 0.000 |
| 16 spectra, NVSVTAYRPLGGSR | 0.000 | 0.007 | 0.130 | 0.000 | 0.000 | 0.359 | 0.504 | 0.000 | ||
| 10 spectra, LLNKPGLR | 0.000 | 0.011 | 0.060 | 0.040 | 0.000 | 0.406 | 0.483 | 0.000 | ||
| 1 spectrum, DMEELLSLDK | 0.000 | 0.007 | 0.024 | 0.000 | 0.000 | 0.298 | 0.671 | 0.000 | ||
| 2 spectra, VAINLGYR | 0.000 | 0.219 | 0.000 | 0.000 | 0.000 | 0.245 | 0.536 | 0.000 | ||
| 2 spectra, ASPGEVTDAVK | 0.000 | 0.000 | 0.141 | 0.000 | 0.000 | 0.306 | 0.552 | 0.000 | ||
| 1 spectrum, NLLVIPK | 0.000 | 0.066 | 0.000 | 0.000 | 0.000 | 0.388 | 0.547 | 0.000 | ||
| 4 spectra, LWCTYHK | 0.000 | 0.000 | 0.000 | 0.253 | 0.000 | 0.000 | 0.747 | 0.000 | ||
| 8 spectra, NIGVSNFNHEQLDR | 0.000 | 0.054 | 0.142 | 0.000 | 0.000 | 0.360 | 0.445 | 0.000 | ||
| 4 spectra, DGVHLMDDIVIR | 0.000 | 0.115 | 0.000 | 0.000 | 0.000 | 0.321 | 0.565 | 0.000 | ||
| 2 spectra, SVNPSR | 0.000 | 0.062 | 0.082 | 0.000 | 0.000 | 0.350 | 0.506 | 0.000 |
| Plot | Mito | Lyso or Perox | ER | Golgi | PM | Cytosol | Nucleus | ||||||
| Expt B |
5 peptides |
14 spectra |
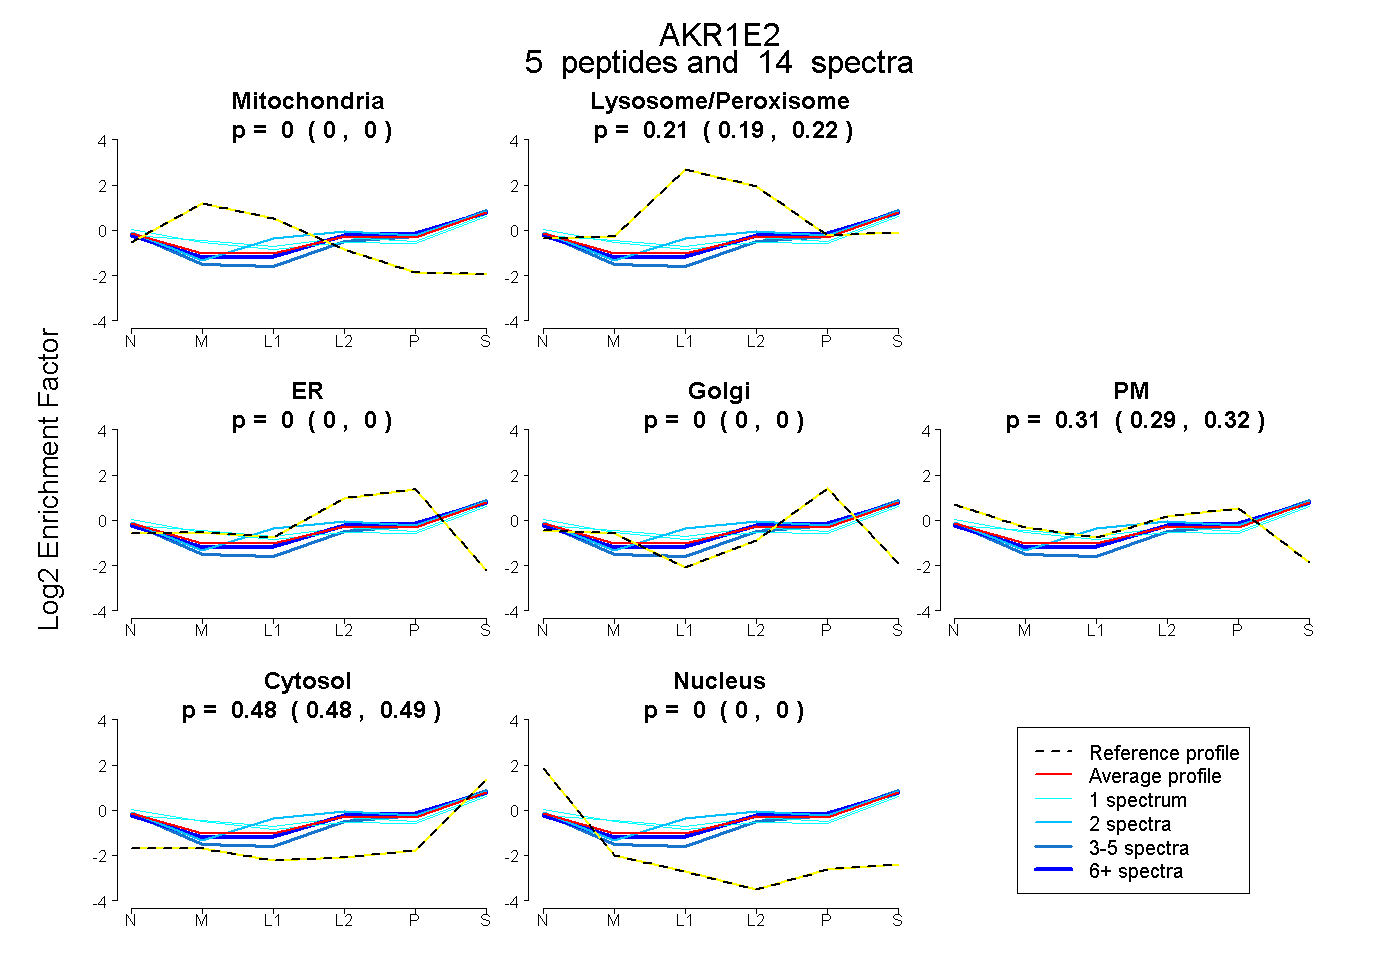 |
0.000 0.000 | 0.000 |
0.206 0.186 | 0.223 |
0.000 0.000 | 0.000 |
0.000 0.000 | 0.000 |
0.309 0.294 | 0.323 |
0.484 0.476 | 0.492 |
0.000 0.000 | 0.000 |
|||
| Plot | Lyso | Other | |||||||||||
| Expt C |
13 peptides |
59 spectra |
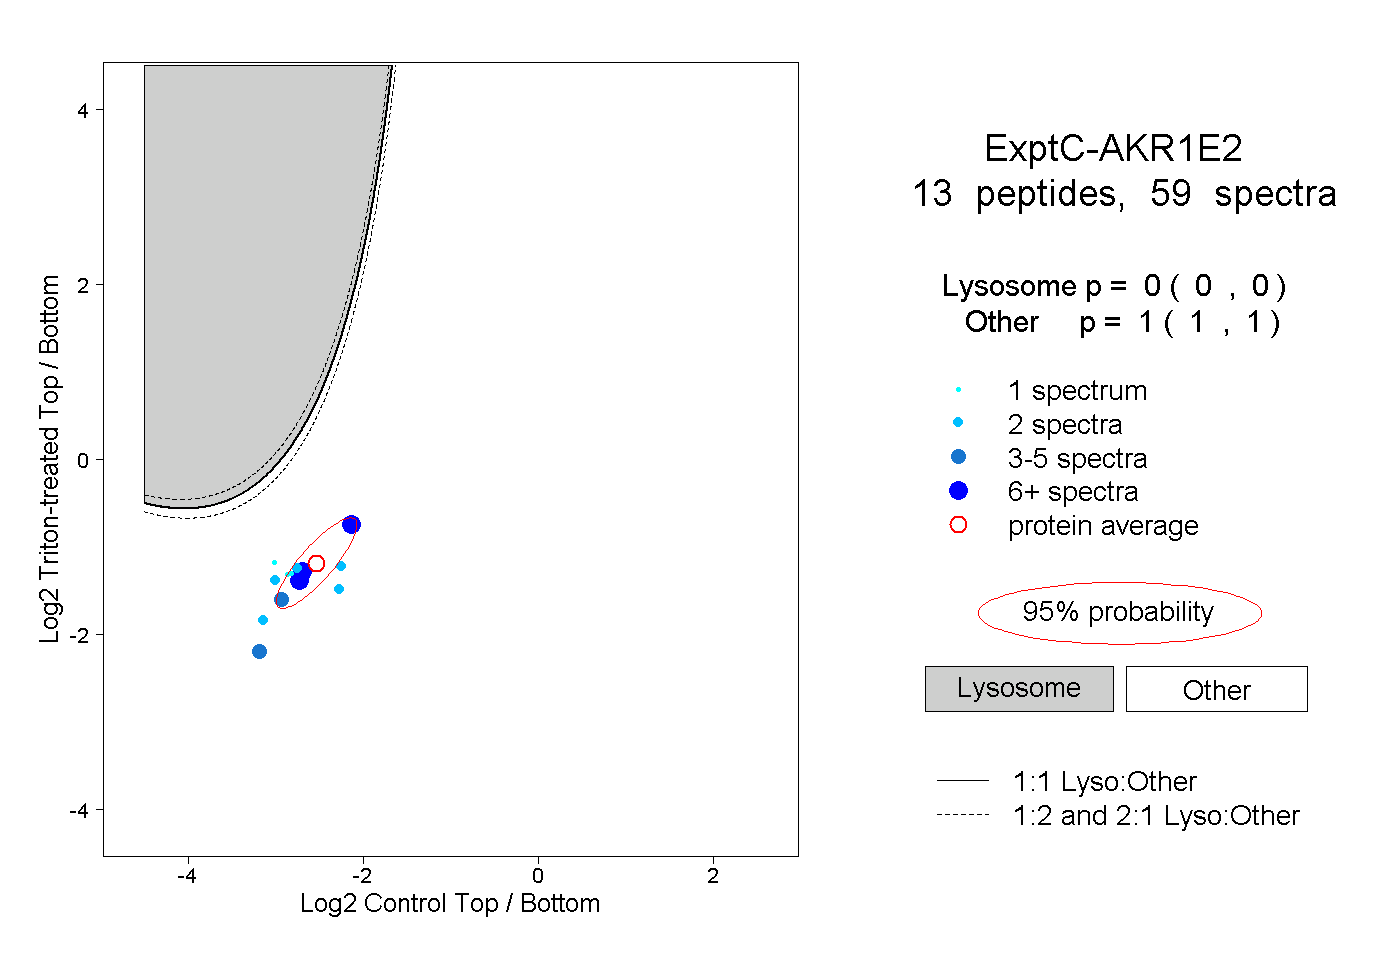 |
0.000 0.000 | 0.000 |
1.000 1.000 | 1.000 |
||||||||
| Plot | Lyso | Other | |||||||||||
| Expt D |
4 peptides |
7 spectra |
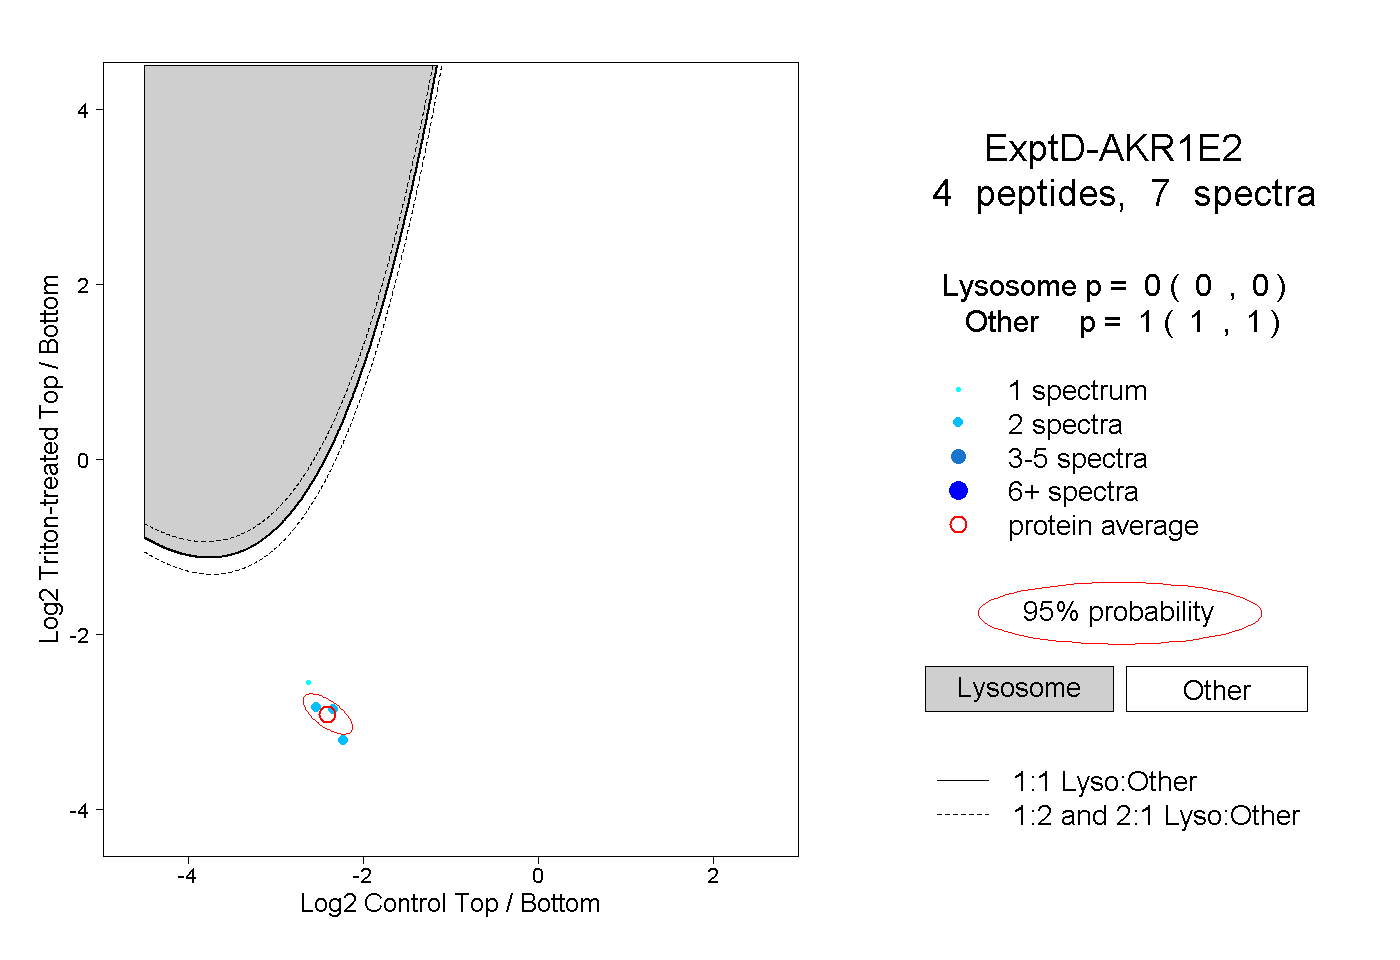 |
0.000 0.000 | 0.000 |
1.000 1.000 | 1.000 |